IBM 2008 Annual Report Download - page 30
Download and view the complete annual report
Please find page 30 of the 2008 IBM annual report below. You can navigate through the pages in the report by either clicking on the pages listed below, or by using the keyword search tool below to find specific information within the annual report.-
 1
1 -
2
-
3
-
4
-
5
-
6
-
7
-
8
-
9
-
10
-
11
-
12
-
13
-
14
-
15
-
16
-
17
-
18
-
19
-
 20
20 -
 21
21 -
 22
22 -
 23
23 -
 24
24 -
 25
25 -
 26
26 -
 27
27 -
 28
28 -
 29
29 -
 30
30 -
 31
31 -
 32
32 -
 33
33 -
 34
34 -
 35
35 -
 36
36 -
 37
37 -
 38
38 -
 39
39 -
 40
40 -
41
-
42
-
43
-
44
-
45
-
46
-
47
-
48
-
49
-
50
-
51
-
52
-
53
-
54
-
55
-
56
-
57
-
58
-
59
-
60
-
61
-
62
-
63
-
64
-
65
-
66
-
67
-
68
-
69
-
70
-
71
-
72
-
73
-
74
-
75
-
76
-
77
-
78
-
79
-
80
-
81
-
82
-
83
-
84
-
85
-
86
-
87
-
88
-
89
-
90
-
91
-
92
-
93
-
94
-
95
-
96
-
97
-
98
-
99
-
100
-
101
-
102
-
103
-
104
-
105
-
106
-
107
-
108
-
109
-
110
-
111
-
112
-
113
-
114
-
115
-
116
-
117
-
118
-
119
-
120
-
121
-
122
-
123
-
124
-
125
-
126
-
127
-
128
 |
 |

Management Discussion
INTERNATIONAL BUSINESS MACHINES CORPORATION and Subsidiary Companies
Management Discussion ................................................................................................18
ROAD MAP ............................................................................................................ 18
FORWARD-LOOKING AND CAUTIONARY STATEMENTS ...................................... 18
MANAGEMENT DISCUSSION SNAPSHOT ............................................................ 19
DESCRIPTION OF BUSINESS................................................................................ 20
YEAR IN REVIEW ..................................................................................................25
PRIOR YEAR IN REVIEW .......................................................................................39
DISCONTINUED OPERATIONS ..............................................................................44
OTHER INFORMATION ..........................................................................................44
GLOBAL FINANCING .............................................................................................53
Report Of Management ............................................................................................... 58
Report Of Independent Registered Public Accounting Firm ................................. 59
Consolidated Statements ............................................................................................ 60
Notes ............................................................................................................................... 66
Contract portfolios purchased in an acquisition are treated as posi-
tive backlog adjustments provided those contracts meet the company’s
requirements for initial signings. A new signing will be recognized if
a new services agreement is signed incidental or coincidental to an
acquisition or divestiture.
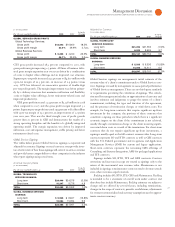
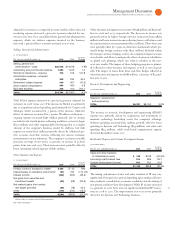
SOFTWARE
($ )
Yr.-to -Yr.
For the year ended December : 2008 2007 Change
SOFTWARE REVENUE: $22,089 $19,982 10.5%
Middleware $17,305 $15,505 11.6%
Key Branded Middleware 12,383 10,827 14.4
WebSphere Family 6.2
Information Management 24.5
Lotus 10.4
Tivoli 2.9
Rational 13.2
Other middleware 4,922 4,678 5.2
Operating systems 2,337 2,319 0.8
Product Lifecycle
Management 960 1,051 (8.6)
Other 1,488 1,107 34.4
Software segment revenue of $, million increased . percent
( percent adjusted for currency) in led by growth in the Key
Branded Middleware products and strong contributions from the
annuity base and acquisitions. Clients continue to embed the compa-
ny’s software in the fabric of their IT infrastructures.
Key Branded Middleware revenue increased . percent ( per-
cent adjusted for currency) and represented percent of total Software
segment revenue, an increase of points from . When adjusted
for currency, growth in was led by Information Management,
Rational and Lotus. Strategic acquisitions, including Cognos and
Telelogic, have extended the segment’s middleware capabilities.
WebSphere Family revenue increased . percent ( percent
adjusted for currency) in and was led by growth in WebSphere
Application Servers and WebSphere Business Integration software.
In December , the company completed the acquisition of ILOG,
whose products help customers improve business decisions with opti-
mization, visualization and business rules software. The WebSphere
products provide the foundation for Web-enabled applications and
are
a key product set in deploying a client’s SOA. Information
Manage ment revenue increased . percent ( percent adjusted
for currency) in versus the prior year, reflecting the contribu-
tion from Cognos and strong demand for the distributed relational
database products. Cognos’ performance management solution helps
customers improve decision-making across the enterprise to opti-
mize business performance.
Lotus revenue increased . percent ( percent adjusted for
currency) in led by growth in Lotus Notes products as customers
continue to invest to improve their workforce efficiency. Lotus soft-
ware is well established as a tool for providing improved workplace
collaboration and productivity.
Tivoli revenue increased . percent ( percent adjusted for cur-
rency) in when compared to . Revenue performance was
led by growth in Tivoli Security and Storage Management products.
Tivoli software provides the advanced capabilities required to run
large mission-critical environments. This includes security and storage
software which helps customers improve utilization and reduce costs.
Rational revenue increased . percent ( percent adjusted for
currency) in driven primarily by Telelogic contributions.
Telelogic’s suite of system programming tools complements Rational’s
IT tool set, providing a common framework for software and systems
delivery across a client’s enterprise.
Revenue from Other middleware products increased . percent
( percent adjusted for currency) in versus the prior year. This
software product set includes more mature products which provide a
more stable flow of revenue.
Other software segment revenue increased . percent ( per-
cent adjusted for currency) versus reflecting continued growth
in software-related services.
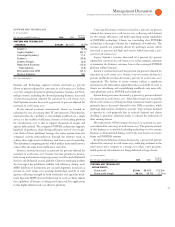
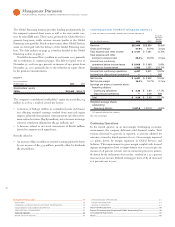
($ )
Yr.-to -Yr.
For the year ended December : 2008 2007 Change
SOFTWARE GROSS PROFIT:
Gross profit $18,859 $17,015 10.8%
Gross profit margin 85.4% 85.2% 0.2 pts.
Software segment gross profit increased . percent to $, mil-
lion in , driven primarily by the strong revenue growth. The
large annuity base of this business continues to provide a predictable
and growing profit stream. Gross profit margin was . percent in
, an increase of . points versus . The company has been
investing significantly in the software business with good results. The
Software segment contributed $, million of pre-tax profit in ,
an increase of . percent versus while successfully integrating
Cognos and Telelogic. Software contributed approximately percent
of the company’s segment pre-tax profit in . The segment pre-tax
profit margin increased . points to . percent. The pre-tax income
and margin improvements have been driven primarily by revenue
growth and increasing operational efficiencies.