IBM 2008 Annual Report Download - page 112
Download and view the complete annual report
Please find page 112 of the 2008 IBM annual report below. You can navigate through the pages in the report by either clicking on the pages listed below, or by using the keyword search tool below to find specific information within the annual report.-
 1
1 -
2
-
3
-
4
-
5
-
6
-
7
-
8
-
9
-
10
-
11
-
12
-
13
-
14
-
15
-
16
-
17
-
18
-
19
-
20
-
21
-
22
-
23
-
24
-
25
-
26
-
27
-
28
-
29
-
30
-
31
-
32
-
33
-
34
-
35
-
36
-
37
-
38
-
39
-
40
-
41
-
42
-
43
-
44
-
45
-
46
-
47
-
48
-
49
-
50
-
51
-
52
-
53
-
54
-
55
-
56
-
57
-
58
-
59
-
60
-
61
-
62
-
63
-
64
-
65
-
66
-
67
-
68
-
69
-
70
-
71
-
72
-
73
-
74
-
75
-
76
-
77
-
78
-
79
-
80
-
81
-
82
-
83
-
84
-
85
-
86
-
87
-
88
-
89
-
90
-
91
-
92
-
93
-
94
-
95
-
96
-
97
-
98
-
99
-
100
-
101
-
 102
102 -
 103
103 -
 104
104 -
 105
105 -
 106
106 -
 107
107 -
 108
108 -
 109
109 -
 110
110 -
 111
111 -
 112
112 -
 113
113 -
 114
114 -
 115
115 -
 116
116 -
 117
117 -
 118
118 -
 119
119 -
 120
120 -
 121
121 -
 122
122 -
123
-
124
-
125
-
126
-
127
-
128
 |
 |

Notes to Consolidated Financial Statements
INTERNATIONAL BUSINESS MACHINES CORPORATION and Subsidiary Companies
Management Discussion ............................................................................................. 18
Consolidated Statements ............................................................................................ 60
Notes ............................................................................................................................... 66
A – E ........................................................................................................................66
F – J ........................................................................................................................86
K– Q .......................................................................................................................88
R –W ..................................................................................................................... 102
R. EARNINGS PER SHARE OF COMMON STOCK .............................................. 102
S. RENTAL EXPENSE AND LEASE COMMITMENTS ........................................... 103
T. STOCK-BASED COMPENSATION ................................................................... 103
U. RETIREMENT-RELATED BENEFITS ............................................................... 10 6
V. SEGMENT INFORMATION .............................................................................. 116
W. SUBSEQUENT EVENT .................................................................................... 119
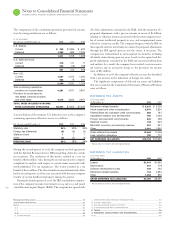
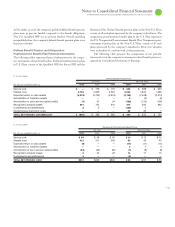
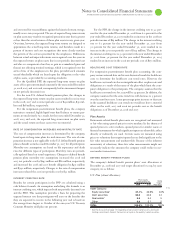
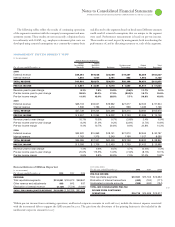
The following table presents the changes in benefit obligations and plan assets of the company’s retirement-related benefit plans.
($ )
Defined Benefit Pension Plans Nonpension Postretirement Benefit Plans
U.S. Plans Non-U.S. Plans* U.S. Plan Non-U.S. Plans
2008 2007 2008 2007 2008 2007 2008 2007
Change in benefit obligation:
Benefit obligation at beginning of year
$47,673 $47,839 $ 42,291 $40,861 $ 5,472 $ 5,773 $ 769 $ 680
Service cost — 773 660 688 55 69 10 12
Interest cost 2,756 2,660 2,042 1,825 312 311 53 46
Plan participants’ contributions — — 63 67 216 199 — —
Acquisitions/divestitures, net — 5 (6) 85 — — (1) —
Actuarial losses/(gains) 1,183 (484) (64) (2,388) (191) (203) (12) (44)
Benefits paid from trust (2,999) (3,046) (1,814) (1,638) (656) (650) (31) (6)
Direct benefit payments (81) (75) (486) (492) (24) (38) (21) (16)
Foreign exchange impact — — (3,357) 3,279 — — (146) 98
Medicare subsidy — — — — 37 10 — —
Plan amendments/curtailments/settlements 224 — (157) 3 3 — (13) —
BENEFIT OBLIGATION AT END OF YEAR $48,756 $47,673 $ 39,171 $42,291 $ 5,224 $ 5,472 $ 608 $ 769
Change in plan assets:
Fair value of plan assets at beginning of year $57,191 $52,913 $ 41,696 $38,207 $ 504 $ 47 $ 121 $ 99
Actual return on plan assets (8,274) 7,324 (7,678) 1,483 415 10 11
Employer contributions — — 858 474 45 893 10 3
Acquisitions/divestitures, net — — 16 52 — — — —
Plan participants’ contributions — — 63 67 216 199 — —
Benefits paid from trust (2,999) (3,046) (1,814) (1,638) (656) (650) (31) (6)
Foreign exchange impact —— (3,978) 3,054 —— (30) 14
Plan amendments/curtailments/settlements — — 2 (3) — — — —
FAIR VALUE OF PLAN ASSETS AT END OF YEAR $45,918 $57,191 $ 29,164 $41,696 $ 113 $ 504 $ 79 $ 121
FUNDED STATUS AT END OF YEAR $ (2,838) $ 9,519 $(10,007) $ (595) $(5,111) $(4,968) $(529) $(648)
Accumulated benefit obligation** $48,756 $47,673 $ 37,759 $40,598 N/A N/A N/A N/A
* Excludes a defined benefit pension plan in Brazil due to restrictions on the use of plan assets imposed by governmental regulations.
** Represents the benefit obligation assuming no future participant compensation increases.
N/A—Not applicable
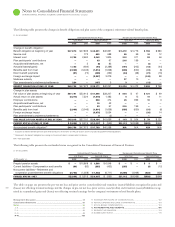
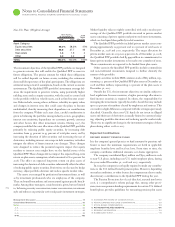
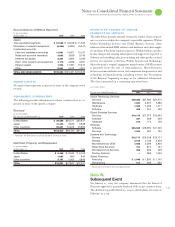
The following table presents the net funded status recognized in the Consolidated Statement of Financial Position.
($ )
Defined Benefit Pension Plans Nonpension Postretirement Benefit Plans
U.S. Plans Non-U.S. Plans U.S. Plan Non-U.S. Plans
At December : 2008 2007 2008 2007 2008 2007 2008 2007
Prepaid pension assets $ — $10,868 $ 1,598 $ 6,548 $ — $ — $ 3 $ —
Current liabilities—Compensation and benefits (86) (82) (283) (432) (255) — (9) (12)
Noncurrent liabilities—Retirement and
nonpension postretirement benefit obligations (2,752) (1,268) (11,322) (6,711) (4,856) (4,968) (523) (636)
FUNDED STATUS — NET $(2,838) $ 9,519 $(10,007) $ (595) $(5,111) $(4,968) $(529) $(648)
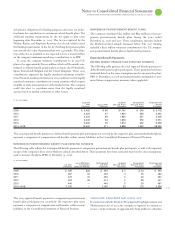
The table on page presents the pre-tax net loss and prior service costs/(credits) and transition (assets)/liabilities recognized in gains and
(l
osses) not affecting retained earnings and the changes in pre-tax net loss, prior service costs/(credits) and transition (assets)/liabilities recog-
nized in accumulated gains and
(l
osses) not affecting retained earnings for the company’s retirement-related benefit plans.