IBM 2008 Annual Report Download - page 104
Download and view the complete annual report
Please find page 104 of the 2008 IBM annual report below. You can navigate through the pages in the report by either clicking on the pages listed below, or by using the keyword search tool below to find specific information within the annual report.-
 1
1 -
2
-
3
-
4
-
5
-
6
-
7
-
8
-
9
-
10
-
11
-
12
-
13
-
14
-
15
-
16
-
17
-
18
-
19
-
20
-
21
-
22
-
23
-
24
-
25
-
26
-
27
-
28
-
29
-
30
-
31
-
32
-
33
-
34
-
35
-
36
-
37
-
38
-
39
-
40
-
41
-
42
-
43
-
44
-
45
-
46
-
47
-
48
-
49
-
50
-
51
-
52
-
53
-
54
-
55
-
56
-
57
-
58
-
59
-
60
-
61
-
62
-
63
-
64
-
65
-
66
-
67
-
68
-
69
-
70
-
71
-
72
-
73
-
74
-
75
-
76
-
77
-
78
-
79
-
80
-
81
-
82
-
83
-
84
-
85
-
86
-
87
-
88
-
89
-
90
-
91
-
92
-
93
-
 94
94 -
 95
95 -
 96
96 -
 97
97 -
 98
98 -
 99
99 -
 100
100 -
 101
101 -
 102
102 -
 103
103 -
 104
104 -
 105
105 -
 106
106 -
 107
107 -
 108
108 -
 109
109 -
 110
110 -
 111
111 -
 112
112 -
 113
113 -
 114
114 -
115
-
116
-
117
-
118
-
119
-
120
-
121
-
122
-
123
-
124
-
125
-
126
-
127
-
128
 |
 |

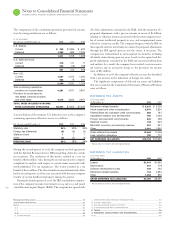
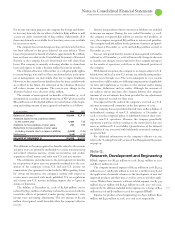
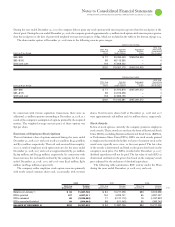
Notes to Consolidated Financial Statements
INTERNATIONAL BUSINESS MACHINES CORPORATION and Subsidiary Companies
Management Discussion ............................................................................................. 18
Consolidated Statements ............................................................................................ 60
Notes ............................................................................................................................... 66
A – E ........................................................................................................................66
F – J ........................................................................................................................86
K– Q .......................................................................................................................88
R –W ..................................................................................................................... 102
R. EARNINGS PER SHARE OF COMMON STOCK ............................................. 102
S. RENTAL EXPENSE AND LEASE COMMITMENTS ......................................... 103
T. STOCK-BASED COMPENSATION .................................................................. 103
U. RETIREMENT-RELATED BENEFITS ................................................................. 106
V. SEGMENT INFORMATION .............................................................................. 116
W. SUBSEQUENT EVENT .................................................................................... 119
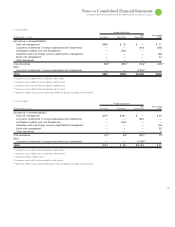
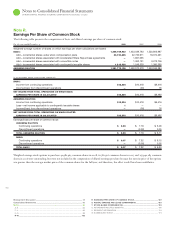
Note R.
Earnings Per Share of Common Stock
The following table presents the computation of basic and diluted earnings per share of common stock.
For the year ended December : 2008 2007 2006
Weighted-average number of shares on which earnings per share calculations are based:
BASIC: 1,359,769,923 1,423,039,793 1,530,806,987
Add — incremental shares under stock compensation plans 20,190,885 22,730,971 18,074,331
Add — incremental shares associated with Accelerated Share Repurchase agreements —1,891,095 —
Add — incremental shares associated with convertible notes —1,362,191 3,273,706
Add — incremental shares associated with contingently issuable shares 1,812,328 1,546,529 1,380,360
ASSUMING DILUTION 1,381,773,136 1,450,570,579 1,553,535,384
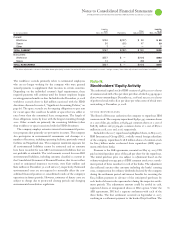
($ )
BASIC:
Income from continuing operations $12,334 $10,418 $9,416
Income/(loss) from discontinued operations —(00) 76
NET INCOME FROM TOTAL OPERATIONS ON WHICH BASIC
EARNINGS PER SHARE IS CALCULATED $12,334 $10,418 $9,492
ASSUMING DILUTION:
Income from continuing operations $12,334 $10,418 $9,416
Less — net income applicable to contingently issuable shares 1— —
Income/(loss) from discontinued operations —(00) 76
NET INCOME FROM TOTAL OPERATIONS ON WHICH DILUTED
EARNINGS PER SHARE IS CALCULATED $12,333 $10,418 $9,492
Earnings/(loss) per share of common stock:
ASSUMING DILUTION:
Continuing operations $ 8.93 $ 7.18 $ 6.06
Discontinued operations —(0.00) 0.05
TOTAL ASSUMING DILUTION $ 8.93 $ 7.18 $ 6.11
BASIC:
Continuing operations $ 9.07 $ 7.32 $ 6.15
Discontinued operations —(0.00) 0.05
TOTAL BASIC $ 9.07 $ 7.32 $ 6.20
Weighted-average stock options to purchase ,, common shares in , ,, common shares in and ,, common
shares in were outstanding, but were not included in the computation of diluted earnings per share because the exercise price of the options
was greater than the average market price of the common shares for the full year, and therefore, the effect would have been antidilutive.