IBM 2008 Annual Report Download - page 22
Download and view the complete annual report
Please find page 22 of the 2008 IBM annual report below. You can navigate through the pages in the report by either clicking on the pages listed below, or by using the keyword search tool below to find specific information within the annual report.-
 1
1 -
2
-
3
-
4
-
5
-
6
-
7
-
8
-
9
-
10
-
11
-
 12
12 -
 13
13 -
 14
14 -
 15
15 -
 16
16 -
 17
17 -
 18
18 -
 19
19 -
 20
20 -
 21
21 -
 22
22 -
 23
23 -
 24
24 -
 25
25 -
 26
26 -
 27
27 -
 28
28 -
 29
29 -
 30
30 -
 31
31 -
 32
32 -
33
-
34
-
35
-
36
-
37
-
38
-
39
-
40
-
41
-
42
-
43
-
44
-
45
-
46
-
47
-
48
-
49
-
50
-
51
-
52
-
53
-
54
-
55
-
56
-
57
-
58
-
59
-
60
-
61
-
62
-
63
-
64
-
65
-
66
-
67
-
68
-
69
-
70
-
71
-
72
-
73
-
74
-
75
-
76
-
77
-
78
-
79
-
80
-
81
-
82
-
83
-
84
-
85
-
86
-
87
-
88
-
89
-
90
-
91
-
92
-
93
-
94
-
95
-
96
-
97
-
98
-
99
-
100
-
101
-
102
-
103
-
104
-
105
-
106
-
107
-
108
-
109
-
110
-
111
-
112
-
113
-
114
-
115
-
116
-
117
-
118
-
119
-
120
-
121
-
122
-
123
-
124
-
125
-
126
-
127
-
128
 |
 |

Management Discussion
INTERNATIONAL BUSINESS MACHINES CORPORATION and Subsidiary Companies
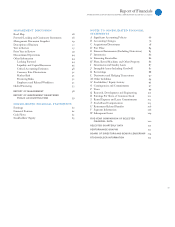
Management Discussion ................................................................................................18
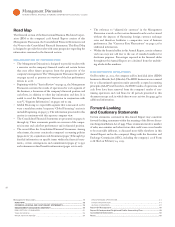
ROAD MAP ............................................................................................................ 18
FORWARD-LOOKING AND CAUTIONARY STATEMENTS ...................................... 18
MANAGEMENT DISCUSSION SNAPSHOT ........................................................... 19
DESCRIPTION OF BUSINESS ...............................................................................20
YEAR IN REVIEW ...................................................................................................25
PRIOR YEAR IN REVIEW ....................................................................................... 39
DISCONTINUED OPERATIONS ..............................................................................44
OTHER INFORMATION ..........................................................................................44
GLOBAL FINANCING .............................................................................................53
Report Of Management ............................................................................................... 58
Report Of Independent Registered Public Accounting Firm ................................. 59
Consolidated Statements ............................................................................................ 60
Notes ............................................................................................................................... 66
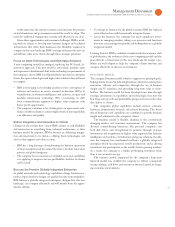
Total expense and other income increased . percent in versus
. The year-to-year drivers were approximately:
• Operational expense, - point
• Acquisitions, + points
• Currency, + points
The effective tax rate for was . percent, compared with .
percent in . The decrease in the tax rate was primarily due to
increased utilization of tax credits.
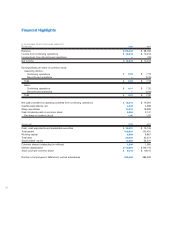
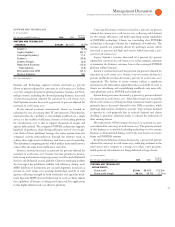
At December , , the company’s balance sheet and liquidity
positions remained strong. Cash on hand was $, million. Total
debt decreased $, million year to year, and the company gener-
ated $, million in operating cash flow in . The company
has consistently generated strong cash flow from operations and also
continues to have access to additional sources of liquidity through
the capital markets and its global credit facility.
Key drivers in the company’s balance sheet and total cash flows
are highlighted below.
Total assets decreased $, million ($, million adjusted
for currency) primarily due to decreases in cash and cash equivalents
($, million), prepaid pension assets ($, million), short-term
marketable securities ($ million) and total financing receivables
($, million). These decreases were partially offset by increases in
long-term deferred taxes ($, million), goodwill ($, million)
and intangible assets ($ million).
Total liabilities increased $, million ($, million adjusted
for currency) driven primarily by increases in retirement and non-
pension postretirement benefit obligations ($, million) and total
deferred income ($ million), partially offset by decreases in total
debt ($, million) and accounts payable ($, million).
Stockholders’ equity of $, million decreased $, million
versus . Net income of $, million was offset by the effects of
pension remeasurements and other retirement-related items ($,
million), common/treasury stock activity ($, million), dividends
($, million) and equity translation adjustments ($, million).
The company generated $, million in cash flow provided by
operating activities, an increase of $, million, compared to ,
primarily driven by increased net income ($, million). Net cash
used in investing activities of $, million was $, million higher
than , primarily due to increased spending for acquisitions
($, million). Net cash used in financing activities of $,
million increased $, million primarily due to debt transactions
($, million), partially offset by lower common stock repur-
chases ($, million) in versus .
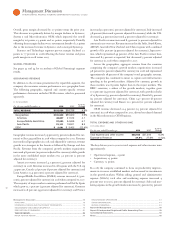
Total Global Services signings increased percent to $,
million ($, million adjusted for currency, flat versus ).
Short-term signings were $, million, an increase of percent
year to year ( percent adjusted for currency), while long-term sign-
ings were $, million, a decrease of percent ( percent adjusted
for currency). The estimated Global Services backlog, adjusted for
currency, was $ billion at December , , down $ billion ver-
sus the December , balance.
For additional information and details, see the “Year in Review”
section on pages to .
Description of Business
Please refer to IBM’s Annual Report on Form -K filed with the SEC
on February , for a more detailed version of this Description of
Business, especially Item A. entitled “Risk Factors.”
The company creates business value for clients and solves business
problems through integrated solutions that leverage information
technology and deep knowledge of business processes. IBM solutions
typically create value by reducing a client’s operational costs or by
enabling new capabilities that generate revenue. These solutions draw
from an industry leading portfolio of consulting, delivery and imple-
mentation services, enterprise software, systems and financing.
In IBM’s view, today’s networked economy has created a global busi-
ness landscape and a mandate for business change. It also opens the
opportunity to upgrade the efficiency and effectiveness of the global
infrastructure through embedded information technology — what
IBM calls a “smarter planet.” Smart airports, smart highways, smart
supply chains are all possible. IBM is working with clients and
governments around the world to explore these opportunities and
implement new ideas.
Integrated global economies have opened markets of new
opportunity and new sources of skills. The Internet has enabled com-
munication and collaboration across the world and brought with it a
new computing model premised on continuous global connection. In
that landscape, companies can distribute work and technology any-
where in the world. IBM continues to adjust its footprint toward
emerging geographies, tapping their higher growth, providing the
technology infrastructure they need and taking advantage of the tal-
ent pools they provide to better service the company’s clients.