IBM 2008 Annual Report Download - page 115
Download and view the complete annual report
Please find page 115 of the 2008 IBM annual report below. You can navigate through the pages in the report by either clicking on the pages listed below, or by using the keyword search tool below to find specific information within the annual report.-
 1
1 -
2
-
3
-
4
-
5
-
6
-
7
-
8
-
9
-
10
-
11
-
12
-
13
-
14
-
15
-
16
-
17
-
18
-
19
-
20
-
21
-
22
-
23
-
24
-
25
-
26
-
27
-
28
-
29
-
30
-
31
-
32
-
33
-
34
-
35
-
36
-
37
-
38
-
39
-
40
-
41
-
42
-
43
-
44
-
45
-
46
-
47
-
48
-
49
-
50
-
51
-
52
-
53
-
54
-
55
-
56
-
57
-
58
-
59
-
60
-
61
-
62
-
63
-
64
-
65
-
66
-
67
-
68
-
69
-
70
-
71
-
72
-
73
-
74
-
75
-
76
-
77
-
78
-
79
-
80
-
81
-
82
-
83
-
84
-
85
-
86
-
87
-
88
-
89
-
90
-
91
-
92
-
93
-
94
-
95
-
96
-
97
-
98
-
99
-
100
-
101
-
102
-
103
-
104
-
 105
105 -
 106
106 -
 107
107 -
 108
108 -
 109
109 -
 110
110 -
 111
111 -
 112
112 -
 113
113 -
 114
114 -
 115
115 -
 116
116 -
 117
117 -
 118
118 -
 119
119 -
 120
120 -
 121
121 -
 122
122 -
 123
123 -
 124
124 -
 125
125 -
126
-
127
-
128
 |
 |

Notes to Consolidated Financial Statements
INTERNATIONAL BUSINESS MACHINES CORPORATION and Subsidiary Companies
and are tested for reasonableness against the historical return average,
usually over a ten-year period. The use of expected long-term returns
on plan assets may result in recognized pension income that is greater
or less than the actual returns of those plan assets in any given year.
Over time, however, the expected long-term returns are designed to
approximate the actual long-term returns, and therefore result in a
pattern of income and cost recognition that more closely matches
the pattern of the services provided by the employees. Differences
between actual and expected returns are recognized over five years in
the expected return on plan assets line in net periodic (income)/cost
and also as a component of net loss or gain in accumulated gains and
(l
osses) not affecting retained earnings, which is recognized over the
service lives of the employees in the plan, provided such amounts
exceed thresholds which are based upon the obligation or the value
of plan assets, as provided by accounting standards.
For the Qualified PPP, the expected long-term return on plan
assets of . percent remained constant for the years ended December
, , and and, consequently, had no incremental impact
on net periodic (income)/cost.
For the non-U.S. defined benefit pension plans, the changes in
the expected long-term return on plan assets resulted in an increase
in the , and net periodic cost of $ million, $ mil-
lion and $ million, respectively.
For the nonpension postretirement benefit plans, the company
maintains a nominal, highly liquid trust fund balance to ensure pay-
ments are made timely. As a result, for the years ended December ,
, and , the expected long-term return on plan assets
and the actual return on those assets were not material.
RATE OF COMPENSATION INCREASES AND MORTALITY RATE
The rate of compensation increases is determined by the company,
based upon its long-term plans for such increases. The rate of com-
pensation increase is not applicable to the U.S. defined benefit pension
plans as benefit accruals ceased December , for all participants.
Mortality rate assumptions are based on life expectancy and death
rates for different types of participants. Mortality rates are periodi-
cally updated based on actual experience. Changes to defined benefit
pension plans mortality rate assumptions increased the and
net periodic cost by $ million and $ million, respectively,
and increased the and benefit obligation by $ million
and $ million, respectively. Changes to the rate of compensation
increases reduced the net periodic cost by $ million.
INTEREST CREDITING RATE
Benefits for certain participants in the PPP are calculated using a
cash balance formula. An assumption underlying this formula is an
interest crediting rate, which impacts both net periodic (income)/cost
and the PBO. This assumption provides a basis for projecting the
expected interest rate that participants will earn on the benefits that
they are expected to receive in the following year and is based on
the average from August to October of the one-year U.S. Treasury
Constant Maturity yield plus one percent.
For the PPP, the change in the interest crediting rate to . per-
cent for the year ended December , from . percent for the
year ended December , resulted in an increase in the net
periodic income of $ million. The change in the interest crediting
rate to . percent for the year ended December , from
. percent for the year ended December , resulted in an
increase in the net periodic cost of $ million. The change in
the interest crediting rate to . percent for the year ended December
, from . percent for the year ended December ,
resulted in an increase in the net periodic cost of $ million.
HEALTHCARE COST TREND RATE
For nonpension postretirement benefit plan accounting, the com-
pany reviews external data and its own historical trends for healthcare
costs to determine the healthcare cost trend rates. However, the
healthcare cost trend rate has an insignificant effect on plan costs and
obligations as a result of the terms of the plan which limit the com-
pany’s obligation to the participants. The company assumes that the
healthcare cost trend rate for will be . percent. In addition, the
company assumes that the same trend rate will decrease to percent
over the next four years. A one percentage point increase or decrease
in the assumed healthcare cost trend rate would not have a material
effect on the , and net periodic cost or the benefit
obligations as of December , and .
Plan Assets
Retirement-related benefit plan assets are recognized and measured
at fair value using quoted prices in active markets. In the absence of
quoted prices in active markets, quoted prices for similar assets or
financial instruments for which significant inputs are observable, either
directly or indirectly, are used. Certain assets are measured using
prices or valuations that require inputs that are both significant to the
fair value measurement and unobservable. Because of the inherent
uncertainty of valuations, these fair value measurements might not
necessarily indicate the amounts the company could realize in cur-
rent market transactions.
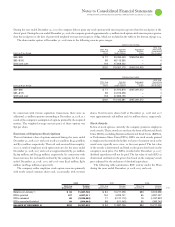
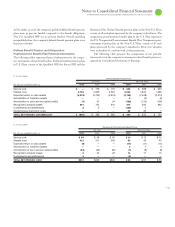
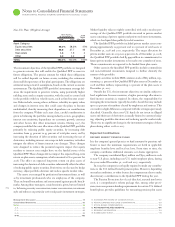
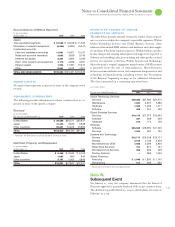
DEFINED BENEFIT PENSION PLANS
The company’s defined benefit pension plans’ asset allocations at
December , and and target allocation for , by asset
category, are as follows:
U.S. Plan (Actual Allocations)
Plan Assets 2009
at December 31: Target
2008 2007 Allocation
Asset Category:
Equity securities* 37.1% 46.9% 46%
Debt securities 54.0 44.6 44
Real estate* 5.9 5.4 5
Other 3.0 3.1 5
TOTAL 100.0% 100.0% 100%
* See the discussion on page 114 regarding certain private market assets, and future
funding commitments thereof, that are not as liquid as the publicly traded securities.