IBM 2008 Annual Report Download - page 40
Download and view the complete annual report
Please find page 40 of the 2008 IBM annual report below. You can navigate through the pages in the report by either clicking on the pages listed below, or by using the keyword search tool below to find specific information within the annual report.-
 1
1 -
2
-
3
-
4
-
5
-
6
-
7
-
8
-
9
-
10
-
11
-
12
-
13
-
14
-
15
-
16
-
17
-
18
-
19
-
20
-
21
-
22
-
23
-
24
-
25
-
26
-
27
-
28
-
29
-
 30
30 -
 31
31 -
 32
32 -
 33
33 -
 34
34 -
 35
35 -
 36
36 -
 37
37 -
 38
38 -
 39
39 -
 40
40 -
 41
41 -
 42
42 -
 43
43 -
 44
44 -
 45
45 -
 46
46 -
 47
47 -
 48
48 -
 49
49 -
 50
50 -
51
-
52
-
53
-
54
-
55
-
56
-
57
-
58
-
59
-
60
-
61
-
62
-
63
-
64
-
65
-
66
-
67
-
68
-
69
-
70
-
71
-
72
-
73
-
74
-
75
-
76
-
77
-
78
-
79
-
80
-
81
-
82
-
83
-
84
-
85
-
86
-
87
-
88
-
89
-
90
-
91
-
92
-
93
-
94
-
95
-
96
-
97
-
98
-
99
-
100
-
101
-
102
-
103
-
104
-
105
-
106
-
107
-
108
-
109
-
110
-
111
-
112
-
113
-
114
-
115
-
116
-
117
-
118
-
119
-
120
-
121
-
122
-
123
-
124
-
125
-
126
-
127
-
128
 |
 |

38
Management Discussion
INTERNATIONAL BUSINESS MACHINES CORPORATION and Subsidiary Companies
Management Discussion ................................................................................................18
ROAD MAP ............................................................................................................ 18
FORWARD-LOOKING AND CAUTIONARY STATEMENTS ...................................... 18
MANAGEMENT DISCUSSION SNAPSHOT ............................................................ 19
DESCRIPTION OF BUSINESS................................................................................ 20
YEAR IN REVIEW ..................................................................................................25
PRIOR YEAR IN REVIEW ......................................................................................39
DISCONTINUED OPERATIONS ..............................................................................44
OTHER INFORMATION ..........................................................................................44
GLOBAL FINANCING .............................................................................................53
Report Of Management ............................................................................................... 58
Report Of Independent Registered Public Accounting Firm ................................. 59
Consolidated Statements ............................................................................................ 60
Notes ............................................................................................................................... 66
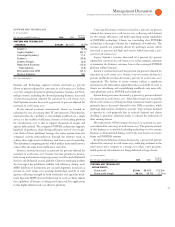
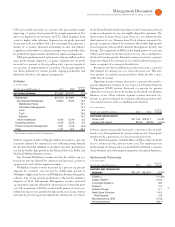
Systems and Technology segment revenue was $5,425 million, a
decrease of 20.2 percent (16 percent adjusted for currency), reflecting
growth in high-end servers offset by a decline in x86 and storage
products. System z revenue decreased 5.9 percent (increased 1 percent
adjusted for currency). Adjusted for currency, revenue performance
was led by double-digit growth in the Americas and strong growth in
the Financial Services and Industrial sectors globally. System z contin-
ues to perform well due to its ability to consolidate multiple workloads
onto a single, virtualized platform. System z MIPS shipments increased
12 percent year to year. This was the fourth consecutive quarter of
double-digit MIPS growth. Converged System p revenue grew 8.0
percent (14 percent adjusted for currency), driven by strong growth
in both high-end and midrange servers. This was the tenth consecu-
tive quarter of revenue growth for converged System p. System x
revenue decreased 33.0 percent (29 percent adjusted for currency)
reflecting a significant slowdown in the industry-standard x86 market
as customers are virtualizing and consolidating workloads onto more
efficient platforms such as POWER and mainframe. System x server
revenue declined 32 percent (28 percent adjusted for currency) with
blades down 27 percent (23 percent adjusted for currency). Legacy
System i revenue decreased 91.6 percent (91 percent adjusted for
currency) as the company continues to transition the System i cus-
tomer base to the converged POWER platform within System p.
Systems Storage revenue decreased 19.9 percent (16 percent
adjusted
for currency) driven by revenue declines in total disk and total
tape
products. Retail Store Solutions revenue decreased 27.8 percent (22
percent adjusted for currency) and Microelectronics OEM revenue
declined 34.3 percent.
Systems and Technology gross margin of 39.9 percent, declined
5.8 points versus the fourth quarter of 2007 driven by margin declines
in
all system brands and Microelectronics OEM; partially offsetting
these
margin declines was a revenue mix benefit due to a shift in
revenue toward System z and converged System p. Systems and
Technology segment pre-tax profit decreased 47.1 percent to $722
million. Pre-tax margin declined 6.7 points to 12.7 percent compared
to the fourth quarter of 2007.
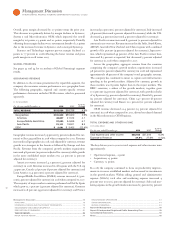
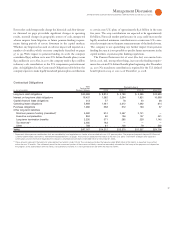
Global Financing revenue of $660 million decreased 1.3 percent
(increased 5 percent adjusted for currency). Increased financing rev-
enue was more than offset by a decline in sales of used equipment.
Geographic revenue decreased 5.6 percent (flat adjusted for cur-
rency) with mixed performance by geography. Adjusted for currency,
Americas had the strongest performance with Europe and Asia
both declining year to year. Globally, revenue in the major markets
decreased 5.3 percent (1 percent adjusted for currency) while revenue
from the company’s growth markets organization decreased 7.1 per-
cent (increased 6 percent adjusted for currency). Americas revenue
was $11,454 million, a decrease of 1.9 percent (increase of 2 percent
adjusted for currency). Adjusted for currency, Latin America was up
12 percent, Canada was up 6 percent and the U.S. was flat. EMEA
revenue decreased 12.2 percent (1 percent adjusted for currency) to
$9,468 million. Revenue performance in the major countries was
mixed when adjusted for currency, with Germany up 7 percent, the
U.K. up 4 percent, France grew 2 percent while Italy declined 8 per-
cent. Asia Pacific revenue decreased 0.7 percent (1 percent adjusted for
currency) to $5,469 million, with growth in the India, Australia/New
Zealand, and South Korea regions, being more than offset by declin-
ing revenue in Japan. The company has been investing heavily in the
emerging markets to capture opportunities to build out public and
private infrastructures. Additionally, these markets benefited in the
quarter from customer demand for cost saving offerings during the
current economic environment. Revenue from these markets repre-
sented 18 percent of the company’s geographic revenue in the quarter
and increased 6 percent, adjusted for currency. The BRIC countries,
a subset of the growth markets, together grew 1.6 percent (13 percent
adjusted for currency) led by double-digit growth in Brazil and India,
adjusted for currency. Russia revenue was significantly impacted by
credit limitations and declined 22 percent in the fourth quarter.
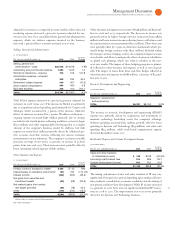
Revenue from the company’s industry sales units decreased
5.7 percent (flat adjusted for currency) in the fourth quarter of 2008.
Public sector revenue decreased 0.8 percent (increased 5 percent
adjusted for currency) with strength in government and with educa-
tion returning to growth, when adjusted for currency. In the growth
markets, clients are investing in education as a way to develop national
skill sets. Industrial sector revenue decreased 8.0 percent (5 percent
adjusted for currency) as concerns with the credit markets and mar-
gin pressures continued. Financial Services sector revenue declined
5.8 percent (1 percent adjusted for currency) and was in line with the
company’s overall performance for the fifth consecutive quarter. The
U.S. financial services sector revenue was up 4 percent and improved
significantly from the third quarter. Growth was driven by banking
and financial markets reflecting strong performance in software,
System z and POWER products. Partially offsetting the U.S. growth
was weakness in Japan and Europe as the economic climate worsened.
Revenue from small and medium business clients declined 8.6 percent
(3 percent adjusted for currency) although services signings in this
customer set increased 10 percent versus the fourth quarter of 2007.