IBM 2008 Annual Report Download - page 45
Download and view the complete annual report
Please find page 45 of the 2008 IBM annual report below. You can navigate through the pages in the report by either clicking on the pages listed below, or by using the keyword search tool below to find specific information within the annual report.-
 1
1 -
2
-
3
-
4
-
5
-
6
-
7
-
8
-
9
-
10
-
11
-
12
-
13
-
14
-
15
-
16
-
17
-
18
-
19
-
20
-
21
-
22
-
23
-
24
-
25
-
26
-
27
-
28
-
29
-
30
-
31
-
32
-
33
-
34
-
 35
35 -
 36
36 -
 37
37 -
 38
38 -
 39
39 -
 40
40 -
 41
41 -
 42
42 -
 43
43 -
 44
44 -
 45
45 -
 46
46 -
 47
47 -
 48
48 -
 49
49 -
 50
50 -
 51
51 -
 52
52 -
 53
53 -
 54
54 -
 55
55 -
56
-
57
-
58
-
59
-
60
-
61
-
62
-
63
-
64
-
65
-
66
-
67
-
68
-
69
-
70
-
71
-
72
-
73
-
74
-
75
-
76
-
77
-
78
-
79
-
80
-
81
-
82
-
83
-
84
-
85
-
86
-
87
-
88
-
89
-
90
-
91
-
92
-
93
-
94
-
95
-
96
-
97
-
98
-
99
-
100
-
101
-
102
-
103
-
104
-
105
-
106
-
107
-
108
-
109
-
110
-
111
-
112
-
113
-
114
-
115
-
116
-
117
-
118
-
119
-
120
-
121
-
122
-
123
-
124
-
125
-
126
-
127
-
128
 |
 |

Management Discussion
INTERNATIONAL BUSINESS MACHINES CORPORATION and Subsidiary Companies
Asia Pacific revenue increased . percent ( percent adjusted
for currency) year over year. Growth was led by strong performance
in the India, Greater China, Australia/New Zealand, ASEAN and
Korea regions, where the economies remain strong, with combined
revenue growth of . percent ( percent adjusted for currency).
Japan revenue, which represented percent of the Asia Pacific rev-
enue base, was flat (increased percent adjusted for currency) in
when compared to , reflecting a slower economy.
Across the geographies, the emerging BRIC countries of Brazil,
Russia, India, and China together grew . percent ( percent
adjusted for currency), reflecting the investments made to build
capabilities and capture opportunities in these countries. Brazil rev-
enue increased . percent ( percent adjusted for currency), Russia
grew . percent ( percent adjusted for currency), India increased
. percent ( percent adjusted for currency) and China increased
. percent ( percent adjusted for currency). In addition to the
BRIC markets, the company also had strong revenue growth in other
nations where there was strong demand for business and IT infra-
structure solutions.
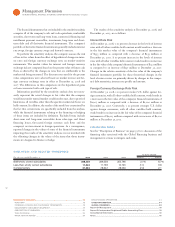
Revenue growth rates, as reported, were impacted in as a
result of the divestiture of the printing business on June , .
Revenue, excluding the printing business in both years, increased as
follows compared to :
• Americas — .%
• EMEA — .%
• Asia Pacific — .%
• IBM Consolidated — .%
OEM revenue decreased . percent ( percent adjusted for cur-
rency) in when compared to , driven by a slowdown in
demand for game processors.
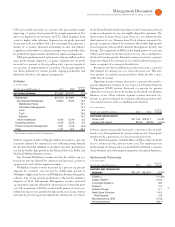
Total Expense and Other Income
Total expense and other income increased . percent ( percent
adjusted for currency) in versus . The increase was primarily
due to increased SG&A expense and interest expense. SG&A expense
increased primarily due to acquisition-related spending, as well as
increased investments in emerging countries and the software and
services businesses. Interest expense increased primarily due to higher
debt levels associated with the financing of the ASR agreements. The
expense-to-revenue ratio increased . points to . percent in ,
as revenue increased . percent and expense increased . percent in
versus .
Total SG&A expense of $, million increased . percent
( percent adjusted for currency) versus . The increase was pri-
marily driven by acquisition-related spending ( points), the effects
of currency ( points) and investments in the software and services
businesses, as well as emerging markets. In addition, bad debt expense
increased $ million primarily due to an increase in the provision for
doubtful accounts. The reserve coverage for receivables of . percent
was essentially flat versus year-end . Ongoing workforce reduc-
tions increased as a result of actions taken to address cost issues in
GTS, primarily in SO, during the second quarter of .
Other (income) and expense was income of $ million and
$ million in and , respectively. The decrease in income
was primarily due to higher losses on derivative instruments. The
company hedges its major cross-border cash flows to mitigate the
effect of currency volatility in the year-over-year results. The impact
of these hedging programs is primarily reflected in other (income) and
expense, as well as cost of goods sold. Losses from derivatives, as a
result of currency movements, resulted in $ million of year-to-year
impact to other (income) and expense. This decrease in income was
partially offset by a gain from the divestiture of the printing business
in the second quarter and sales of Lenovo stock in the first and sec-
ond quarters of .
RD&E expense of $, million increased . percent primarily
driven by acquisitions and investments to maintain technology leader-
ship across the product offerings. Software spending increased $
million partially offset by lower Systems and Technology spending of
$ million.
Intellectual property and custom development income of $ mil-
lion increased $ million or . percent versus . There were no
significant IP transactions in and .
Interest expense of $ million increased $ million, or .
percent in primarily due to the higher debt associated with the
financing of the ASR agreements.
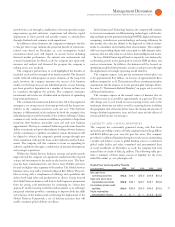
Income Taxes
The provision for income taxes resulted in an effective tax rate of
. percent for , compared with the effective tax rate of
. percent. The . point decrease was primarily driven by the
absence of the one-time tax cost associated with the intercompany
transfer of certain intellectual property in the fourth quarter of
(. points) and the absence of the benefit from the settlement of the
U.S. federal income tax audit for the years through , also in
the fourth quarter of (. points). The company also benefited
in from a more favorable mix of income in lower tax rate juris-
dictions and increased capital loss and state credit benefits, offset by
a reduction in certain tax incentives.
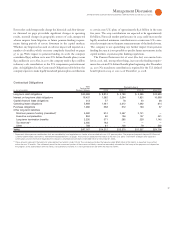
Financial Position
Assets of $, million increased $, million ($, million
adjusted for currency) primarily due to increases in cash and cash
equivalents ($, million), prepaid pension assets ($, mil-
lion), total financing receivables ($, million) and goodwill
($, million). These increases were partially offset by decreases in
long-term deferred tax assets ($, million) and short-term mar-
ketable securities ($, million).
Liabilities of $, million increased $, million ($,
million adjusted for currency) driven primarily by increases in total
debt ($, million), tax liabilities ($, million) and total
deferred income ($, million).