IBM 2008 Annual Report Download - page 54
Download and view the complete annual report
Please find page 54 of the 2008 IBM annual report below. You can navigate through the pages in the report by either clicking on the pages listed below, or by using the keyword search tool below to find specific information within the annual report.-
 1
1 -
2
-
3
-
4
-
5
-
6
-
7
-
8
-
9
-
10
-
11
-
12
-
13
-
14
-
15
-
16
-
17
-
18
-
19
-
20
-
21
-
22
-
23
-
24
-
25
-
26
-
27
-
28
-
29
-
30
-
31
-
32
-
33
-
34
-
35
-
36
-
37
-
38
-
39
-
40
-
41
-
42
-
43
-
 44
44 -
 45
45 -
 46
46 -
 47
47 -
 48
48 -
 49
49 -
 50
50 -
 51
51 -
 52
52 -
 53
53 -
 54
54 -
 55
55 -
 56
56 -
 57
57 -
 58
58 -
 59
59 -
 60
60 -
 61
61 -
 62
62 -
 63
63 -
 64
64 -
65
-
66
-
67
-
68
-
69
-
70
-
71
-
72
-
73
-
74
-
75
-
76
-
77
-
78
-
79
-
80
-
81
-
82
-
83
-
84
-
85
-
86
-
87
-
88
-
89
-
90
-
91
-
92
-
93
-
94
-
95
-
96
-
97
-
98
-
99
-
100
-
101
-
102
-
103
-
104
-
105
-
106
-
107
-
108
-
109
-
110
-
111
-
112
-
113
-
114
-
115
-
116
-
117
-
118
-
119
-
120
-
121
-
122
-
123
-
124
-
125
-
126
-
127
-
128
 |
 |

Management Discussion
INTERNATIONAL BUSINESS MACHINES CORPORATION and Subsidiary Companies
Management Discussion ................................................................................................18
ROAD MAP ............................................................................................................ 18
FORWARD-LOOKING AND CAUTIONARY STATEMENTS ...................................... 18
MANAGEMENT DISCUSSION SNAPSHOT ............................................................ 19
DESCRIPTION OF BUSINESS................................................................................ 20
YEAR IN REVIEW ...................................................................................................25
PRIOR YEAR IN REVIEW .......................................................................................39
DISCONTINUED OPERATIONS ..............................................................................44
OTHER INFORMATION ..........................................................................................44
GLOBAL FINANCING ............................................................................................53
Report Of Management ............................................................................................... 58
Report Of Independent Registered Public Accounting Firm ................................. 59
Consolidated Statements ............................................................................................ 60
Notes ............................................................................................................................... 66
The financial instruments that are included in the sensitivity analysis
comprise all of the company’s cash and cash equivalents, marketable
securities, short-term and long-term loans, commercial financing and
installment payment receivables, investments, long-term and short-
term debt and all derivative financial instruments. The company’s
portfolio of derivative financial instruments generally includes interest
rate swaps, foreign currency swaps and forward contracts.
To perform the sensitivity analysis, the company assesses the risk
of loss in fair values from the effect of hypothetical changes in inter-
est rates and foreign currency exchange rates on market-sensitive
instruments. The market values for interest and foreign currency
exchange risk are computed based on the present value of future cash
flows as affected by the changes in rates that are attributable to the
market risk being measured. The discount rates used for the present
value computations were selected based on market interest and for-
eign currency exchange rates in effect at December , and
. The differences in this comparison are the hypothetical gains
or losses associated with each type of risk.
Information provided by the sensitivity analysis does not neces-
sarily represent the actual changes in fair value that the company
would incur under normal market conditions because, due to practical
limitations, all variables other than the specific market risk factor are
held constant. In addition, the results of the model are constrained by
the fact that certain items are specifically excluded from the analysis,
while the financial instruments relating to the financing or hedging
of those items are included by definition. Excluded items include
short-term and long-term receivables from sales-type and direct
financing leases, forecasted foreign currency cash flows and the
company’s net investment in foreign operations. As a consequence,
reported changes in the values of some of the financial instruments
impacting the results of the sensitivity analysis are not matched with
the offsetting changes in the values of the items that those instru-
ments are designed to finance or hedge.
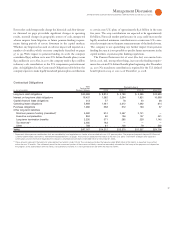
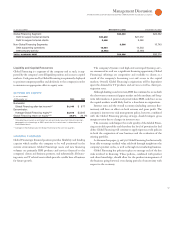
The results of the sensitivity analysis at December , , and
December , , are as follows:
Interest Rate Risk
At December , , a percent decrease in the levels of interest
rates with all other variables held constant would result in a decrease
in the fair market value of the company’s financial instruments
of $ million as compared with a decrease of $ million at
December , . A percent increase in the levels of interest
rates with all other variables held constant would result in an increase
in the fair value of the company’s financial instruments of $ million
as compared to an increase of $ million at December , .
Changes in the relative sensitivity of the fair value of the company’s
financial instrument portfolio for these theoretical changes in the
level of interest rates are primarily driven by changes in the compa-
ny’s debt maturities, interest rate profile and amount.
Foreign Currency Exchange Rate Risk
At December , , a percent weaker U.S. dollar against for-
eign currencies, with all other variables held constant, would result in
a decrease in the fair value of the company’s financial instruments of
$, million as compared with a decrease of $, million at
December , . Conversely, a percent stronger U.S. dollar
against foreign currencies, with all other variables held constant,
would result in an increase in the fair value of the company’s financial
instruments of $, million compared with an increase of $,
million at December , .
See the “Description of Business” on page for a discussion of the
financing risks associated with the Global Financing business and
management’s actions to mitigate such risks.
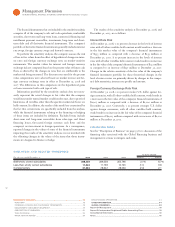
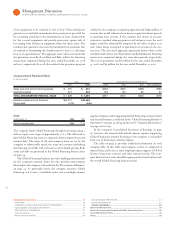
Yr.-t o -Yr. Change
For the year ended December : 2008 2007 2006 2008-07 2 0 0 7- 0 6
IBM/wholly owned subsidiaries 398,455 386,558 355,766 3.1% 8.7%
Less-than-wholly owned subsidiaries 11,642 11,769 10,720 (1.1) 9.8
Complementary 27,983 28,642 28,063 (2.3) 2.1