IBM 2008 Annual Report Download - page 43
Download and view the complete annual report
Please find page 43 of the 2008 IBM annual report below. You can navigate through the pages in the report by either clicking on the pages listed below, or by using the keyword search tool below to find specific information within the annual report.-
 1
1 -
2
-
3
-
4
-
5
-
6
-
7
-
8
-
9
-
10
-
11
-
12
-
13
-
14
-
15
-
16
-
17
-
18
-
19
-
20
-
21
-
22
-
23
-
24
-
25
-
26
-
27
-
28
-
29
-
30
-
31
-
32
-
 33
33 -
 34
34 -
 35
35 -
 36
36 -
 37
37 -
 38
38 -
 39
39 -
 40
40 -
 41
41 -
 42
42 -
 43
43 -
 44
44 -
 45
45 -
 46
46 -
 47
47 -
 48
48 -
 49
49 -
 50
50 -
 51
51 -
 52
52 -
 53
53 -
54
-
55
-
56
-
57
-
58
-
59
-
60
-
61
-
62
-
63
-
64
-
65
-
66
-
67
-
68
-
69
-
70
-
71
-
72
-
73
-
74
-
75
-
76
-
77
-
78
-
79
-
80
-
81
-
82
-
83
-
84
-
85
-
86
-
87
-
88
-
89
-
90
-
91
-
92
-
93
-
94
-
95
-
96
-
97
-
98
-
99
-
100
-
101
-
102
-
103
-
104
-
105
-
106
-
107
-
108
-
109
-
110
-
111
-
112
-
113
-
114
-
115
-
116
-
117
-
118
-
119
-
120
-
121
-
122
-
123
-
124
-
125
-
126
-
127
-
128
 |
 |

Management Discussion
INTERNATIONAL BUSINESS MACHINES CORPORATION and Subsidiary Companies
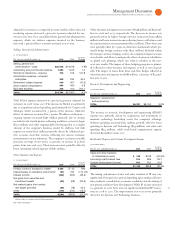
GTS gross profit increased . percent with gross profit margin
improving . points, driven primarily by margin expansion in SO,
due to an improved cost structure, and ITS, which benefited from
a mix to higher value offerings. Segment pre-tax profit increased
. percent to $, million with a pre-tax margin of . percent, a
decline of . points. Increased investments in sales and delivery,
acquisitions and workforce reduction charges were essentially offset
by productivity improvements and effective expense management.
GBS gross profit increased . percent to $, million and the
gross profit margin improved . points. Segment pre-tax profit
increased . percent to $, million with a pre-tax margin of
. percent, an improvement of . points. The margin expansion
was driven primarily by revenue growth, ongoing productivity and
utilization initiatives, and expense management.
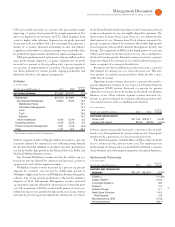
Software
($ )
Yr.-to-Yr.
For the year ended December : 2007 2006* Change
SOFTWARE REVENUE: $19,982 $18,161 10.0%
Middleware: $15,505 $13,891 11.6%
Key Branded Middleware 10,827 9,373 15.5
WebSphere Family 19.1
Information Management 14.7
Lotus 8.7
Tivoli 18.0
Rational 13.7
Other middleware 4,678 4,518 3.5
Operating systems 2,319 2,273 2.0
Product Lifecycle Management 1,051 1,123 (6.4)
Other 1,107 874 26.7
* Reclassified to conform with 2007 presentation.
Software segment revenue of $, million increased . percent
( percent adjusted for currency) in reflecting strong demand
for the Key Branded Middleware products. Revenue performance
was led by double-digit growth in the Financial Services, Public and
Small and Medium Business sectors.
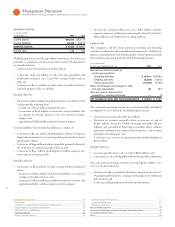
Key Branded Middleware revenue was $, million, up .
percent ( percent adjusted for currency) and increased points to
percent of total software segment revenue.
WebSphere Family revenue increased . percent ( percent
adjusted for currency) and was led by double-digit growth in
WebSphere Application Servers and WebSphere Business Integration
software. The strong revenue performance reflected the industry’s
adoption of SOA. Information Management revenue increased
. percent ( percent adjusted for currency) in versus the prior
year. The acquisition of FileNet, in the fourth quarter of , con-
tributed strong revenue growth throughout the year. Lotus revenue
increased . percent ( percent adjusted for currency) in driven
by the Notes/Domino family of products. Lotus Connections, released
in the second quarter of , was rapidly adopted by customers. The
latest version of Lotus Notes, Lotus Notes ., was delivered in the
third quarter of . Revenue from Tivoli software increased .
percent ( percent adjusted for currency) with double-digit growth
in each segment of the portfolio: Systems Management, Security and
Storage. The acquisitions of MRO, in the fourth quarter of , and
Vallent and Consul, in the first quarter of , also contributed to
the brand’s revenue growth. Rational revenue increased . percent
( percent adjusted for currency) in which reflected strong cus-
tomer acceptance of its integrated product set.
Revenue from Other middleware products increased . percent
(flat adjusted for currency) in versus the prior year. This soft-
ware product set includes mature products which provide a more
stable flow of revenue.
Operating systems revenue increased . percent (decreased
percent adjusted for currency) in versus . Product Lifecycle
Management (PLM) revenue decreased . percent ( percent
adjusted for currency) driven by declines in the Small and Medium
Business sector. Other software segment revenue increased .
percent ( percent adjusted for currency) reflecting growth in soft-
ware-related services, such as consulting and education.
($ )
Yr.-to-Yr.
For the year ended December : 2007 2006 Change
SOFTWARE GROSS PROFIT:
Gross profit $17,015 $15,471 10.0%
Gross profit margin 85.2% 85.2% 0.0
pts.
Software segment gross profit increased . percent to $, mil-
lion in , driven primarily by strong revenue growth. Gross profit
margin was . percent in , flat versus the prior year.
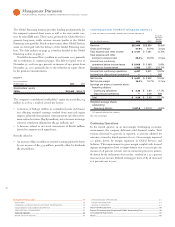
The Software segment contributed $, million of pre-tax profit
in , an increase of . percent versus . The segment pre-tax
profit margin of . percent was essentially flat (declined . points)
versus the prior year, reflecting the integration of acquired businesses.
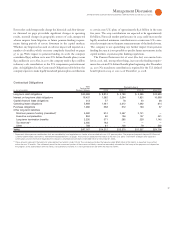
Systems and Technology
($ )
Yr.-to-Yr.
For the year ended December : 2007 2006 Change
SYSTEMS AND TECHNOLOGY
REVENUE: $21,317 $21,970 (3.0)%
System z (11.2)%
Legacy System i (10.6)
Converged System p 8.8
System x 7.0
System Storage 5.1
Retail Store Solutions 14.5
Total Systems 2.8
Microelectronics OEM (11.8)
Printing Systems (63.1)