IBM 2008 Annual Report Download - page 123
Download and view the complete annual report
Please find page 123 of the 2008 IBM annual report below. You can navigate through the pages in the report by either clicking on the pages listed below, or by using the keyword search tool below to find specific information within the annual report.-
 1
1 -
2
-
3
-
4
-
5
-
6
-
7
-
8
-
9
-
10
-
11
-
12
-
13
-
14
-
15
-
16
-
17
-
18
-
19
-
20
-
21
-
22
-
23
-
24
-
25
-
26
-
27
-
28
-
29
-
30
-
31
-
32
-
33
-
34
-
35
-
36
-
37
-
38
-
39
-
40
-
41
-
42
-
43
-
44
-
45
-
46
-
47
-
48
-
49
-
50
-
51
-
52
-
53
-
54
-
55
-
56
-
57
-
58
-
59
-
60
-
61
-
62
-
63
-
64
-
65
-
66
-
67
-
68
-
69
-
70
-
71
-
72
-
73
-
74
-
75
-
76
-
77
-
78
-
79
-
80
-
81
-
82
-
83
-
84
-
85
-
86
-
87
-
88
-
89
-
90
-
91
-
92
-
93
-
94
-
95
-
96
-
97
-
98
-
99
-
100
-
101
-
102
-
103
-
104
-
105
-
106
-
107
-
108
-
109
-
110
-
111
-
112
-
 113
113 -
 114
114 -
 115
115 -
 116
116 -
 117
117 -
 118
118 -
 119
119 -
 120
120 -
 121
121 -
 122
122 -
 123
123 -
 124
124 -
 125
125 -
 126
126 -
 127
127 -
 128
128
 |
 |

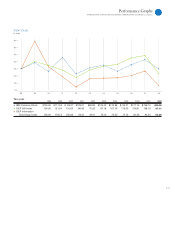
Selected Quarterly Data
INTERNATIONAL BUSINESS MACHINES CORPORATION and Subsidiary Companies
($ )
First Second Third Fourth Full
2008: Quarter Quarter Quarter Quarter Year
Revenue $24,502 $26,820 $25,302 $27,006 $103,630
Gross profit $10,166 $11,599 $10,959 $12,936 $ 45,661
Income from continuing operations $ 2,319 $ 2,765 $ 2,824 $ 4,427 $ 12,334
Income/(loss) from discontinued operations — — — — —
Net income $ 2,319 $ 2,765 $ 2,824 $ 4,427 $ 12,334*
Earnings per share of common stock:
Assuming dilution:
Continuing operations $ 1.65 $ 1.98 $ 2.05 $ 3.28 $ 8.93*
Discontinued operations — — — — —
Total $ 1.65 $ 1.98 $ 2.05 $ 3.28 $ 8.93*
Basic:
Continuing operations $ 1.68 $ 2.02 $ 2.09 $ 3.31 $ 9.07*
Discontinued operations — — — — —
Total $ 1.68 $ 2.02 $ 2.09 $ 3.31 $ 9.07*
Dividends per share of common stock $ 0.40 $ 0.50 $ 0.50 $ 0.50 $ 1.90
Stock prices:**
High $119.78 $129.99 $130.92 $116.80
Low 97.04 113.86 109.95 69.50
First Second Third Fourth Full
2007: Quarter Quarter Quarter Quarter Year
Revenue $22,029 $23,772 $24,119 $28,866 $98,786
Gross profit $ 8,866 $ 9,938 $ 9,956 $12,970 $41,729
Income from continuing operations $ 1,844 $ 2,261 $ 2,362 $ 3,951 $10,418
Income/(loss) from discontinued operations — (1) (1) 1 (00)
Net income $ 1,844 $ 2,260 $ 2,361 $ 3,952 $10,418*
Earnings/(loss) per share of common stock:
Assuming dilution:
Continuing operations $ 1.21 $ 1.55 $ 1.68 $ 2.80 $ 7.18*
Discontinued operations — (0.00) (0.00) 0.00 (0.00)
Total $ 1.21 $ 1.55 $ 1.68 $ 2.80 $ 7.18*
Basic:
Continuing operations $ 1.23 $ 1.57 $ 1.72 $ 2.85 $ 7.32*
Discontinued operations — (0.00) (0.00) 0.00 (0.00)
Total $ 1.23 $ 1.57 $ 1.72 $ 2.86 $ 7.32*
Dividends per share of common stock $ 0.30 $ 0.40 $ 0.40 $ 0.40 $ 1.50
Stock prices:**
High $100.90 $108.04 $118.89 $121.45
Low 88.77 93.92 104.58 99.27
* Earnings Per Share (EPS) in each quarter is computed using the weighted-average number of shares outstanding during that quarter while EPS for the full year is computed using the
weighted-average number of shares outstanding during the year. Thus, the sum of the four quarters’ EPS does not equal the full-year EPS.
** The stock prices reflect the high and low prices for IBM’s common stock on the New York Stock Exchange composite tape for the last two years.