IBM 2008 Annual Report Download - page 47
Download and view the complete annual report
Please find page 47 of the 2008 IBM annual report below. You can navigate through the pages in the report by either clicking on the pages listed below, or by using the keyword search tool below to find specific information within the annual report.-
 1
1 -
2
-
3
-
4
-
5
-
6
-
7
-
8
-
9
-
10
-
11
-
12
-
13
-
14
-
15
-
16
-
17
-
18
-
19
-
20
-
21
-
22
-
23
-
24
-
25
-
26
-
27
-
28
-
29
-
30
-
31
-
32
-
33
-
34
-
35
-
36
-
 37
37 -
 38
38 -
 39
39 -
 40
40 -
 41
41 -
 42
42 -
 43
43 -
 44
44 -
 45
45 -
 46
46 -
 47
47 -
 48
48 -
 49
49 -
 50
50 -
 51
51 -
 52
52 -
 53
53 -
 54
54 -
 55
55 -
 56
56 -
 57
57 -
58
-
59
-
60
-
61
-
62
-
63
-
64
-
65
-
66
-
67
-
68
-
69
-
70
-
71
-
72
-
73
-
74
-
75
-
76
-
77
-
78
-
79
-
80
-
81
-
82
-
83
-
84
-
85
-
86
-
87
-
88
-
89
-
90
-
91
-
92
-
93
-
94
-
95
-
96
-
97
-
98
-
99
-
100
-
101
-
102
-
103
-
104
-
105
-
106
-
107
-
108
-
109
-
110
-
111
-
112
-
113
-
114
-
115
-
116
-
117
-
118
-
119
-
120
-
121
-
122
-
123
-
124
-
125
-
126
-
127
-
128
 |
 |

Management Discussion
INTERNATIONAL BUSINESS MACHINES CORPORATION and Subsidiary Companies
growth from through a combination of revenue growth, margin
improvement, growth initiatives, acquisitions and effective capital
deployment to fund growth and provide returns to shareholders
through dividends and common stock repurchases.
In addition to these elements, the company’s roadmap to the $
to $ per share range includes the projected benefit of retire ment-
related costs based on December , assumptions. Actual
retirement-related costs will depend on several factors including
financial market performance, the interest rate environment and
actuarial assumptions. In March , the company met again with
investors and analysts and discussed the progress the company is
making on its roadmap.
The company’s performance in highlighted the benefits of
its global reach and the strength of its business model. The financial
results reflected solid progress on major elements of the long-term
goals, however, the company measures the success of its business
model over the long term, not any individual quarter or year. Earnings
per share growth is dependent on a number of factors and may not
be consistent throughout the periods. The company’s strategies,
investments and actions are all taken with an objective of optimizing
long-term performance.
The continued investments in Software have led to this segment’s
emergence as a strong source of revenue growth and the largest con-
tributor to the company’s profit in and . The Software
business is differentiated in the industry by both the strength of its
individual products and the breadth of the software offerings. Clients
continue to rely on the extensive middleware portfolio to help them
transform their business, streamline costs and seek new business
opportunities. The key to continued Software growth stems from the
ability to maintain and grow this industry-leading software business,
and by continuing to capitalize on industry trends. Investments will
be aligned to advance the company’s growth strategy through new
client acquisition, with specific focus on key industries and local busi-
nesses. The company will also continue to focus on expanding its
software capabilities through a combination of internal development
and strategic acquisitions.
Within the Global Services business, revenue and profit growth
improved and the company saw significant results from the targeted
actions and investments it has made in the last few years. The busi-
ness has been transformed into one that is more flexible and more
focused on higher value segments of the market. The Global Services
business enters with a revenue backlog of $ billion. The port-
folio is strong with a complement of offerings and capabilities that
deliver both high value and productivity to clients. Going forward
the Global Services business will look to build upon its momentum
from the strong performance by continuing its “clients first
approach” and by focusing on further enhancements to its offerings/
integrated solutions portfolio, continuing to improve both the skills
and structure of the business and accelerating the deployment of the
Global Delivery Framework, a set of delivery practices that will
enable consistent global delivery excellence.
In the Systems and Technology business, the company will continue
to focus its investments on differentiating technologies with leader-
ship and high-growth potential including POWER, high-performance
computing, virtualization, nanotechnology and energy efficiency. In
this market, the value has shifted to the high end to address clients’
needs to consolidate and virtualize their environments. The company
will focus on providing clients with a clear path to a fully dynamic infra-
structure that not only reduces cost, but is both intelligent and secure.
In , Global Financing will seek to expand its core business by
accelerating growth in the participation rates for IBM products and
services transactions. In addition, the business will be focused on
optimizing its global infrastructure, resources and processes through
the deployment of its single operating model initiative.
The company expects pre-tax retirement-related plan cost
to be approximately $. billion, an increase of approximately $
million compared to . This estimate reflects current pension plan
assumptions and the impacts of recent pension plan redesign efforts.
See note U, “Retirement-Related Benefits,” on pages to for
additional information.
The company expects in the normal course of business that its
effective tax rate in will be approximately . percent. The rate
will change year to year based on non-recurring events, such as the
settlement of income tax audits, as well as recurring factors including
the geographic mix of income before taxes, the timing and amount of
foreign dividend repatriation, state and local taxes and the effects of
various global income tax strategies.
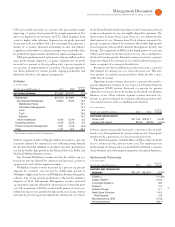
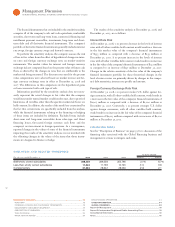
The company has consistently generated strong cash flow from
operations, providing a source of funds ranging between $. billion
and $. billion per year over the past five years. The company
provides for additional liquidity through several sources: maintaining
a sizable cash balance, access to global funding sources, a committed
global credit facility and other committed and uncommitted lines
of credit worldwide. At December , , the company had total
unused lines of credit of $, million. The following table pro-
vides a summary of these major sources of liquidity for the years
ended December , through .
Cash Flow and Liquidity Trends
($ ) 2008 2007 2006 2005 2004
Net cash from
operating activities $18.8 $16.1 $15.0 $14.9 $15.3
Cash and short-term
marketable securities $12.9 $16.1 $10.7 $13.7 $10.6
Committed global credit
facilities $10.0 $10.0 $10.0 $10.0 $10.0
Trade receivables
securitization facility $ — $ — $ — $ 0.5 $ 0.5