IBM 2008 Annual Report Download - page 39
Download and view the complete annual report
Please find page 39 of the 2008 IBM annual report below. You can navigate through the pages in the report by either clicking on the pages listed below, or by using the keyword search tool below to find specific information within the annual report.-
 1
1 -
2
-
3
-
4
-
5
-
6
-
7
-
8
-
9
-
10
-
11
-
12
-
13
-
14
-
15
-
16
-
17
-
18
-
19
-
20
-
21
-
22
-
23
-
24
-
25
-
26
-
27
-
28
-
 29
29 -
 30
30 -
 31
31 -
 32
32 -
 33
33 -
 34
34 -
 35
35 -
 36
36 -
 37
37 -
 38
38 -
 39
39 -
 40
40 -
 41
41 -
 42
42 -
 43
43 -
 44
44 -
 45
45 -
 46
46 -
 47
47 -
 48
48 -
 49
49 -
50
-
51
-
52
-
53
-
54
-
55
-
56
-
57
-
58
-
59
-
60
-
61
-
62
-
63
-
64
-
65
-
66
-
67
-
68
-
69
-
70
-
71
-
72
-
73
-
74
-
75
-
76
-
77
-
78
-
79
-
80
-
81
-
82
-
83
-
84
-
85
-
86
-
87
-
88
-
89
-
90
-
91
-
92
-
93
-
94
-
95
-
96
-
97
-
98
-
99
-
100
-
101
-
102
-
103
-
104
-
105
-
106
-
107
-
108
-
109
-
110
-
111
-
112
-
113
-
114
-
115
-
116
-
117
-
118
-
119
-
120
-
121
-
122
-
123
-
124
-
125
-
126
-
127
-
128
 |
 |

Management Discussion
INTERNATIONAL BUSINESS MACHINES CORPORATION and Subsidiary Companies
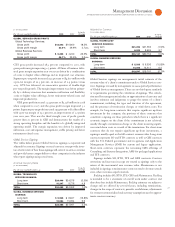
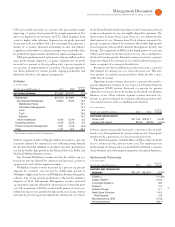
Fourth quarter revenue performance was impacted by currency
and the changing economic environment, but the modest decline of
. percent adjusted for currency reflects the company’s broad busi-
ness capabilities and contribution from the annuity content of the
business model. Adjusted for currency, revenue performance was led
by growth in the Software and Global Services segments offset by a
decline in Systems and Technology.
The Global Services segments combined had $, million of
revenue in the fourth quarter, a decrease of . percent (increase of
percent adjusted for currency) and delivered pre-tax profit of
$, million, an increase of . percent year to year. The services
business performed exceptionally well in the current economic envi-
ronment through disciplined execution on resource optimization and
improved operating efficiencies, while at the same time delivering
services with a high level of quality and customer satisfaction. Total
signings for Global Services in the fourth quarter were $, million,
a decrease of percent (increase of percent adjusted for currency)
versus the fourth quarter of . Signings in the quarter included
deals larger than $ million. Long-term signings of $, million
decreased percent (increased percent adjusted for currency) with
a percent growth in Strategic Outsourcing signings. Short-term
signings decreased percent ( percent adjusted for currency) to
$, million, compared to a very strong fourth quarter of .
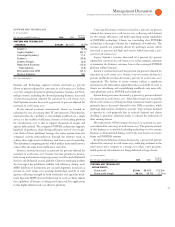
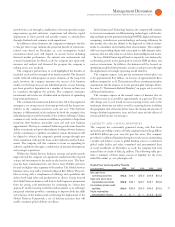
GTS revenue of $, million decreased . percent (increased
percent adjusted for currency) versus the fourth quarter of .
GTS signings of $, million decreased percent (increased
percent adjusted for currency) with long-term signings increasing
percent ( percent adjusted for currency) to $, million, offset
by a percent decrease ( percent adjusted for currency) in short-
term signings. SO revenue decreased . percent (increased percent
adjusted for currency). SO signings increased percent ( percent
adjusted for currency) led by strong signings in the U.S. and Europe
as clients turn to outsourcing’s value proposition as an effective way
to attain their financial objectives in this economic climate. ITS
revenue increased . percent ( percent adjusted for currency). ITS
signings decreased percent ( percent adjusted for currency),
although signings in the key infrastructure offerings continued to be
good. BTO revenue decreased . percent ( percent adjusted for
currency) and signings decreased percent ( percent adjusted for
currency). GTS gross profit increased . percent in the quarter and
the gross margin improved . points with margin expansion in all
lines of business. The GTS segment fourth-quarter pre-tax profit was
up . percent and the margin improved . points to . percent
from fourth-quarter . This was the sixth consecutive quarter of
double-digit pre-tax profit growth in GTS. The margin improve-
ment was driven primarily by a delivery structure that maximizes
utilization and flexibility, a mix to higher value offerings, lower total
managed labor costs and a global skills mix that efficiently moves
resources to opportunities.
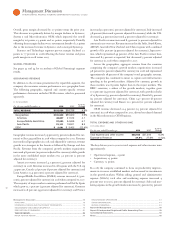
GBS revenue of $, million decreased . percent (flat
adjusted for currency) compared to fourth-quarter . In the cur-
rent economy, offerings that deliver cost savings continued to drive
the majority of business, although demand for transformational and
compliance offerings also increased. GBS signings of $, mil-
lion, decreased percent ( percent adjusted for currency), driven by
a percent decline ( percent adjusted for currency) in long-term
signings. Short-term signings of $, million decreased percent
(increased percent adjusted for currency) in the quarter. Cost savings
offerings accounted for the majority of the new signings. GBS gross
profit increased . percent in the quarter with the gross margin
improving . points. The GBS segment pre-tax profit increased
. percent in the quarter and the margin expanded . points to
. percent. The margin performance reflects a strong operating
discipline and the benefits of a globally integrated operating model.
Despite slower revenue growth, utilization improved year to year
resulting from resource optimization throughout the globally inte-
grated capacity model as well as effective balancing of domestic, global
and subcontracted resources. GBS also benefited from continued deal
selectivity, stable pricing, lower managed labor costs and ongoing
operational efficiencies.
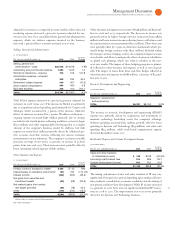
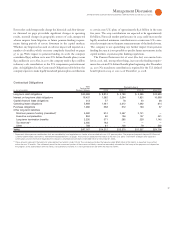
Software segment revenue of $, million, increased . percent
( percent adjusted for currency), driven by solid sales execution and
growth in mission critical production software. Customers continue
to utilize infrastructure software in their production environments to
optimize their data centers. Many large customers signed multi-year
deals in the fourth quarter demonstrating continued commitment to
the company’s technology. Revenue growth was led by Americas with
an increase of percent, adjusted for currency. Revenue from Key
Branded Middleware increased . percent ( percent adjusted for
currency) and represented percent of total software revenue.
Revenue from the WebSphere Family of products declined . per-
cent (increased percent adjusted for currency) in the quarter.
Information Management revenue increased . percent ( percent
adjusted for currency) driven by contribution from Cognos as well as
organic growth. Revenue from Distributed Relational Database prod-
ucts increased over percent, adjusted for currency. Lotus revenue
decreased . percent (increased percent adjusted for currency)
capitalizing on the strong performance of collaboration software.
Tivoli software revenue decreased . percent (increased percent
adjusted for currency). Rational revenue decreased . percent
(increased percent adjusted for currency) compared to a strong
fourth-quarter with revenue performance led by Telelogic.
Software gross profit increased . percent with margin improve-
ment of . points. The Software segment delivered pre-tax profit of
$, million, an increase of . percent. The pre-tax margin of
. percent increased . points compared to fourth-quarter .
The large annuity base in the software business continues to provide
a predictable and growing stream of profit and cash.