IBM 2008 Annual Report Download - page 120
Download and view the complete annual report
Please find page 120 of the 2008 IBM annual report below. You can navigate through the pages in the report by either clicking on the pages listed below, or by using the keyword search tool below to find specific information within the annual report.-
 1
1 -
2
-
3
-
4
-
5
-
6
-
7
-
8
-
9
-
10
-
11
-
12
-
13
-
14
-
15
-
16
-
17
-
18
-
19
-
20
-
21
-
22
-
23
-
24
-
25
-
26
-
27
-
28
-
29
-
30
-
31
-
32
-
33
-
34
-
35
-
36
-
37
-
38
-
39
-
40
-
41
-
42
-
43
-
44
-
45
-
46
-
47
-
48
-
49
-
50
-
51
-
52
-
53
-
54
-
55
-
56
-
57
-
58
-
59
-
60
-
61
-
62
-
63
-
64
-
65
-
66
-
67
-
68
-
69
-
70
-
71
-
72
-
73
-
74
-
75
-
76
-
77
-
78
-
79
-
80
-
81
-
82
-
83
-
84
-
85
-
86
-
87
-
88
-
89
-
90
-
91
-
92
-
93
-
94
-
95
-
96
-
97
-
98
-
99
-
100
-
101
-
102
-
103
-
104
-
105
-
106
-
107
-
108
-
109
-
 110
110 -
 111
111 -
 112
112 -
 113
113 -
 114
114 -
 115
115 -
 116
116 -
 117
117 -
 118
118 -
 119
119 -
 120
120 -
 121
121 -
 122
122 -
 123
123 -
 124
124 -
 125
125 -
 126
126 -
 127
127 -
 128
128
 |
 |

Notes to Consolidated Financial Statements
INTERNATIONAL BUSINESS MACHINES CORPORATION and Subsidiary Companies
Management Discussion ............................................................................................. 18
Consolidated Statements ............................................................................................ 60
Notes ............................................................................................................................... 66
A – E ........................................................................................................................66
F – J ........................................................................................................................86
K– Q .......................................................................................................................88
R –W ..................................................................................................................... 102
R. EARNINGS PER SHARE OF COMMON STOCK .............................................. 102
S. RENTAL EXPENSE AND LEASE COMMITMENTS ........................................... 10 3
T. STOCK-BASED COMPENSATION ................................................................... 103
U. RETIREMENT-RELATED BENEFITS ................................................................. 106
V. SEGMENT INFORMATION .............................................................................. 116
W. SUBSEQUENT EVENT .................................................................................... 119
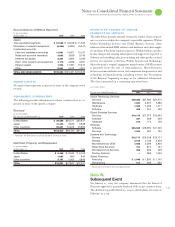
Investment in Equity Alliances and Equity
Alliances Gains/(Losses)
The investments in equity alliances and the resulting gains and
(l
osses) from these investments that are attributable to the segments
did not have a material effect on the financial position or the financial
results of the segments.
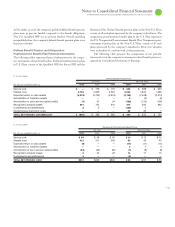
Global Technology Services assets are primarily accounts receivable,
plant, property and equipment including those associated with the
segment’s outsourcing business, goodwill, acquired intangible assets,
deferred services arrangement transition costs and maintenance parts
inventory. Global Business Services assets are primarily goodwill and
accounts receivable. Software segment assets are mainly goodwill, intan-
gible assets and accounts receivable. Systems and Technology assets
are primarily plant, property and equipment, manufacturing inventory
and accounts receivable. The assets of the Global Financing segment are
primarily financing receivables and fixed assets under operating leases.
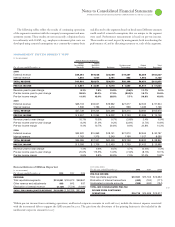
To accomplish the efficient use of the company’s space and
equipment, it usually is necessary for several segments to share plant,
property and equipment assets. Where assets are shared, landlord
ownership of the assets is assigned to one segment and is not allocated
to each user segment. This is consistent with the company’s manage-
ment system and is reflected accordingly in the table below. In those
cases, there will not be a precise correlation between segment pre-tax
income and segment assets.
Similarly, the depreciation amounts reported by each segment are
based on the assigned landlord ownership and may not be consistent
with the amounts that are included in the segments’ pre-tax income.
The amounts that are included in pre-tax income reflect occupancy
charges from the landlord segment and are not specifically identified
by the management reporting system. Capital expenditures that are
reported by each segment also are consistent with the landlord own-
ership basis of asset assignment.
The Global Financing segment amounts for interest income and
interest expense reflect the interest income and interest expense associ-
ated with the Global Financing business, including the intercompany
financing activities discussed on page , as well as the income from
investment in cash and marketable securities. The explanation of the
difference between cost of financing and interest expense for seg-
ment presentation versus presentation in the Consolidated Statement
of Earnings is included on page of the Management Discussion.
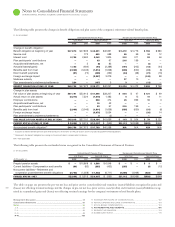
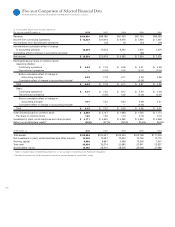
($ )
Global Services Segments
Global Global
Technology Business Systems and Global Total
For the year ended December : Services Services Software Technology Financing Segments
2008:
Assets $15,456 $6,874 $15,336 $7,313 $36,119 $81,098
Depreciation/amortization of intangibles 1,797 99 905 851 2,065 5,718
Capital expenditures/investments in intangibles 1,607 54 504 754 2,143 5,062
Interest income — — — — 2,604 2,604
Interest expense — — — — 988 988
2007:
Assets $16,157 $7,226 $10,042 $7,338 $37,586 $78,348
Depreciation/amortization of intangibles 1,714 122 684 894 2,034 5,448
Capital expenditures/investments in intangibles 1,803 61 559 840 2,432 5,694
Interest income — — — — 2,421 2,421
Interest expense — — — — 966 966
2006:
Assets $14,483 $6,517 $ 9,262 $7,437 $33,945 $71,643
Depreciation/amortization of intangibles 1,575 136 632 1,024 1,691 5,058
Capital expenditures/investments in intangibles 1,714 43 423 777 2,514 5,470
Interest income — — — — 2,265 2,265
Interest expense — — — — 792 792