IBM 2008 Annual Report Download - page 31
Download and view the complete annual report
Please find page 31 of the 2008 IBM annual report below. You can navigate through the pages in the report by either clicking on the pages listed below, or by using the keyword search tool below to find specific information within the annual report.-
 1
1 -
2
-
3
-
4
-
5
-
6
-
7
-
8
-
9
-
10
-
11
-
12
-
13
-
14
-
15
-
16
-
17
-
18
-
19
-
20
-
 21
21 -
 22
22 -
 23
23 -
 24
24 -
 25
25 -
 26
26 -
 27
27 -
 28
28 -
 29
29 -
 30
30 -
 31
31 -
 32
32 -
 33
33 -
 34
34 -
 35
35 -
 36
36 -
 37
37 -
 38
38 -
 39
39 -
 40
40 -
 41
41 -
42
-
43
-
44
-
45
-
46
-
47
-
48
-
49
-
50
-
51
-
52
-
53
-
54
-
55
-
56
-
57
-
58
-
59
-
60
-
61
-
62
-
63
-
64
-
65
-
66
-
67
-
68
-
69
-
70
-
71
-
72
-
73
-
74
-
75
-
76
-
77
-
78
-
79
-
80
-
81
-
82
-
83
-
84
-
85
-
86
-
87
-
88
-
89
-
90
-
91
-
92
-
93
-
94
-
95
-
96
-
97
-
98
-
99
-
100
-
101
-
102
-
103
-
104
-
105
-
106
-
107
-
108
-
109
-
110
-
111
-
112
-
113
-
114
-
115
-
116
-
117
-
118
-
119
-
120
-
121
-
122
-
123
-
124
-
125
-
126
-
127
-
128
 |
 |

Management Discussion
INTERNATIONAL BUSINESS MACHINES CORPORATION and Subsidiary Companies
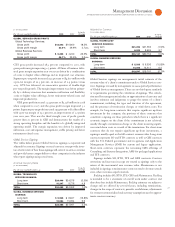
SYSTEMS AND TECHNOLOGY
($ )
Yr.-to-Yr.
For the year ended December : 2008 2007 Change
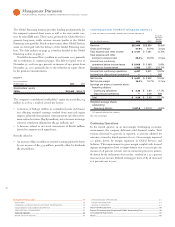
SYSTEMS AND TECHNOLOGY
REVENUE: $19,287 $21,317 (9.5)%
System z 12.5%
Legacy System i (66.1)
Converged System p 11.2
System x (16.9)
System Storage (3.4)
Retail Store Solutions (15.0)
Total Systems (4.9)
Microelectronics OEM (25.1)
Printing Systems NM
NM—Not meaningful
Systems and Technology segment revenue decreased . percent
(down percent adjusted for currency) in versus . In June
, the company divested its printing business. Systems and Tech-
nology revenue, excluding the divested printing business, decreased
. percent ( percent adjusted for currency) in versus .
Total Systems revenue decreased . percent ( percent adjusted for
currency) in versus .
In the current economic environment, clients are focused on
reducing the cost of running their IT infrastructure. Virtualization,
which provides the capability to run multiple workloads on a single
server, is a key enabler of efficiency. System z is the leading platform
for virtualization as it is able to support thousands of images and
operate fully utilized. The company’s POWER architecture supports
hundreds of partitions, often driving utilization rates of over per-
cent. Both of these platforms leverage the entire system, from the
company’s custom semiconductors through the software stack, to
achieve these high levels of efficiency and lower cost of ownership.
The distributed computing model, which utilizes many small servers,
cannot offer the same level of efficiency and value.
System z revenue increased . percent ( percent adjusted for
currency) in versus . System z revenue growth was particu-
larly strong in the Americas (up percent), as well as in the Financial
Services and Industrial sectors globally. Clients in emerging markets
also leveraged this platform’s stability and efficiency during .
MIPS (millions of instructions per second) shipments increased
percent in versus , posting double-digit growth in each
quarter, reflecting strength in both traditional and specialty work-
loads. Specialty MIPS increased percent in , as clients exploit
the capabilities of System z to bring new Linux and Java applications
to this highly efficient and cost effective platform.
Converged System p revenue increased . percent ( percent
adjusted for currency) in versus , reflecting solid demand
for the energy efficiencies and multi-operating system capabilities
of POWER technology. Clients are concluding that POWER
technology is the right solution for a multitude of workloads. The
revenue growth was primarily driven by midrange servers which
increased percent and high-end servers which increased per-
cent in versus .
Legacy System i revenue decreased . percent ( percent
adjusted for currency) in versus , as the company continues
to transition the System i customer base to the converged POWER
platform within System p.
System x revenue decreased . percent ( percent adjusted for
currency) in versus . System x server revenue declined
percent and blades revenue decreased percent, in versus ,
respectively. The decline in server revenue reflects a significant
slowdown in the x market, especially in the second half of , as
clients are virtualizing and consolidating workloads onto more effi-
cient platforms such as POWER and mainframe.
System Storage revenue decreased . percent ( percent adjusted
for currency) in versus . Total disk revenue was essentially
flat in versus . Enterprise Disk revenue increased percent
primarily due to increased demand for the DS product, while
midrange disk revenue declined percent. Tape revenue declined
percent in primarily due to reduced demand and clients
deciding to purchase additional media to expand the utilization of
their existing devices.
Microelectronics OEM revenue decreased . percent ( per-
cent adjusted for currency) in versus . The primary mission
of this business is to provide leadership technology for the systems
business, as demonstrated during in the new System z main-
frame and POWER systems.
Retail Stores Solutions revenue decreased . percent ( percent
adjusted for currency) in versus , reflecting weakness in the
retail sector and a compare to a strong , when a new program-
mable point-of-sale solution was being delivered to large clients.
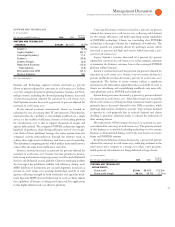
($ )
Yr.-to-Yr.
For the year ended December : 2008 2007 Change
SYSTEMS AND TECHNOLOGY
GROSS PROFIT:
Gross profit $7,341 $8,468 (13.3)%
Gross profit margin 38.1% 39.7% (1.7) pts.