IBM 2008 Annual Report Download - page 56
Download and view the complete annual report
Please find page 56 of the 2008 IBM annual report below. You can navigate through the pages in the report by either clicking on the pages listed below, or by using the keyword search tool below to find specific information within the annual report.-
 1
1 -
2
-
3
-
4
-
5
-
6
-
7
-
8
-
9
-
10
-
11
-
12
-
13
-
14
-
15
-
16
-
17
-
18
-
19
-
20
-
21
-
22
-
23
-
24
-
25
-
26
-
27
-
28
-
29
-
30
-
31
-
32
-
33
-
34
-
35
-
36
-
37
-
38
-
39
-
40
-
41
-
42
-
43
-
44
-
45
-
 46
46 -
 47
47 -
 48
48 -
 49
49 -
 50
50 -
 51
51 -
 52
52 -
 53
53 -
 54
54 -
 55
55 -
 56
56 -
 57
57 -
 58
58 -
 59
59 -
 60
60 -
 61
61 -
 62
62 -
 63
63 -
 64
64 -
 65
65 -
 66
66 -
67
-
68
-
69
-
70
-
71
-
72
-
73
-
74
-
75
-
76
-
77
-
78
-
79
-
80
-
81
-
82
-
83
-
84
-
85
-
86
-
87
-
88
-
89
-
90
-
91
-
92
-
93
-
94
-
95
-
96
-
97
-
98
-
99
-
100
-
101
-
102
-
103
-
104
-
105
-
106
-
107
-
108
-
109
-
110
-
111
-
112
-
113
-
114
-
115
-
116
-
117
-
118
-
119
-
120
-
121
-
122
-
123
-
124
-
125
-
126
-
127
-
128
 |
 |

Management Discussion
INTERNATIONAL BUSINESS MACHINES CORPORATION and Subsidiary Companies
Management Discussion ................................................................................................18
ROAD MAP ............................................................................................................ 18
FORWARD-LOOKING AND CAUTIONARY STATEMENTS ...................................... 18
MANAGEMENT DISCUSSION SNAPSHOT ............................................................ 19
DESCRIPTION OF BUSINESS................................................................................ 20
YEAR IN REVIEW ...................................................................................................25
PRIOR YEAR IN REVIEW .......................................................................................39
DISCONTINUED OPERATIONS ..............................................................................44
OTHER INFORMATION ..........................................................................................44
GLOBAL FINANCING ............................................................................................53
Report Of Management ............................................................................................... 58
Report Of Independent Registered Public Accounting Firm ................................. 59
Consolidated Statements ............................................................................................ 60
Notes ............................................................................................................................... 66
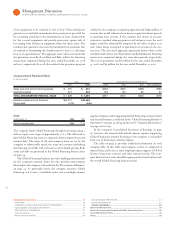
The increase in revenue, as compared to , was primarily
due to:
• An increase in external revenue of . percent (flat adjusted for
currency), due to growth in financing revenue (up . percent to
$, million), partially offset by a decrease in used equipment
sales (down . percent to $ million); and
• Growth in internal revenue of . percent primarily driven by an
increase in used equipment sales to the Systems and Technology
segment (up . percent to $, million) and an increase in
internal financing (up . percent to $ million).
The increase in external and internal financing revenue was due to
higher average asset balances and higher asset yields.
Global Financing gross profit increased . percent compared to
, with gross margin increasing . points. This was due to higher
margins on financing and used equipment sales.
The increase in revenue, as compared to , was primarily
due to:
• Growth in external revenue of . percent ( percent adjusted for
currency) primarily driven by increased used equipment sales (up
. percent to $ million); partially offset by
• A decline in internal revenue of . percent, due primarily to
lower used equipment sales to the Systems and Technology seg-
ment (down . percent to $ million), partially offset by an
increase in internal financing revenue of . percent to $
million. The increase in financing revenue was due to higher
average asset balances and higher asset yields.
Global Financing gross profit increased . percent in versus
, with gross margin declining . points. This was due to higher
margin used equipment sales largely offset by margin compression
on financing revenue due to higher borrowing costs.
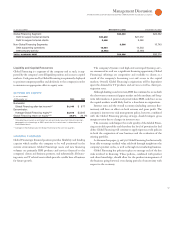
Global Financing pre-tax income increased . percent in
versus , compared to a decrease of . percent in versus
. The increase in was driven by the increase in gross profit
of $ million, partially offset by an increase in accounts receivable
provisions of $ million. The decrease in was driven by an
increase of $ million in accounts receivable provisions, partially
offset by the increase in gross profit of $ million. The increase in
accounts receivable provisions in was primarily due to current
economic conditions. Overall accounts receivable coverage rate is .
percent at December , , an increase of . points versus .
The increase in return on equity from to was primarily
due to higher after-tax income, while the decrease from to
was primarily due to lower after-tax income.
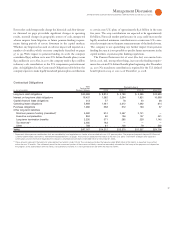
Balance Sheet
($ )
At December : 2008 2007
Cash and cash equivalents $ 1,269 $ 755
Net investment in sales-type and
direct financing leases 10,203 10,876
Equipment under operating leases:
External clients
(a) 2,139 2,401
Internal clients (b) (c) 1,709 1,872
Client loans 10,615 10,667
Total client financing assets 24,667 25,816
Commercial financing receivables 5,875 6,375
Intercompany financing receivables (b) (c) 2,957 2,984
Other receivables 396 368
Other assets 956 1,288
TOTAL ASSETS $36,119 $37,586
Intercompany payables (b) $ 5,391 $ 6,934
Debt
(d) 24,360 24,532
Other liabilities 2,875 2,672
Total liabilities 32,626 34,138
Total equity 3,493 3,448
TOTAL LIABILITIES AND EQUITY $36,119 $37,586
(a) Includes intercompany mark-up, priced on an arms-length basis, on products purchased
from the company’s product divisions, which is eliminated in IBM’s consolidated results.
(b) Entire amount eliminated for purposes of IBM’s consolidated results and therefore does
not appear on page 61.
(c) These assets, along with all other financing assets in this table, are leveraged at the
value in the table using Global Financing debt.
(d) Global Financing debt is comprised of intercompany loans and external debt. A portion
of Global Financing debt is in support of the company’s internal business, or related to
intercompany mark-up embedded in the Global Financing assets. See table on page 57.
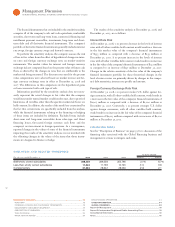
Sources and Uses of Funds
The primary use of funds in Global Financing is to originate client
and commercial financing assets. Client financing assets for end users
consist primarily of IBM hardware, software and services, but also
include non-IBM equipment, software and services to meet IBM cli-
ents’ total solutions requirements. Client financing assets are primarily
sales type, direct financing and operating leases for equipment, as
well as loans for hardware, software and services with terms generally
for two to seven years. Global Financing’s client loans are primarily
for software and services and are unsecured. These loans are subjected
to additional credit analysis in order to mitigate the associated risk and,
when deemed necessary, covenants are put into agreements to protect
against credit deterioration during the life of the obligation. Client
financing also includes internal activity as described on page .