IBM 2008 Annual Report Download - page 113
Download and view the complete annual report
Please find page 113 of the 2008 IBM annual report below. You can navigate through the pages in the report by either clicking on the pages listed below, or by using the keyword search tool below to find specific information within the annual report.-
 1
1 -
2
-
3
-
4
-
5
-
6
-
7
-
8
-
9
-
10
-
11
-
12
-
13
-
14
-
15
-
16
-
17
-
18
-
19
-
20
-
21
-
22
-
23
-
24
-
25
-
26
-
27
-
28
-
29
-
30
-
31
-
32
-
33
-
34
-
35
-
36
-
37
-
38
-
39
-
40
-
41
-
42
-
43
-
44
-
45
-
46
-
47
-
48
-
49
-
50
-
51
-
52
-
53
-
54
-
55
-
56
-
57
-
58
-
59
-
60
-
61
-
62
-
63
-
64
-
65
-
66
-
67
-
68
-
69
-
70
-
71
-
72
-
73
-
74
-
75
-
76
-
77
-
78
-
79
-
80
-
81
-
82
-
83
-
84
-
85
-
86
-
87
-
88
-
89
-
90
-
91
-
92
-
93
-
94
-
95
-
96
-
97
-
98
-
99
-
100
-
101
-
102
-
 103
103 -
 104
104 -
 105
105 -
 106
106 -
 107
107 -
 108
108 -
 109
109 -
 110
110 -
 111
111 -
 112
112 -
 113
113 -
 114
114 -
 115
115 -
 116
116 -
 117
117 -
 118
118 -
 119
119 -
 120
120 -
 121
121 -
 122
122 -
 123
123 -
124
-
125
-
126
-
127
-
128
 |
 |

Notes to Consolidated Financial Statements
INTERNATIONAL BUSINESS MACHINES CORPORATION and Subsidiary Companies
($ )
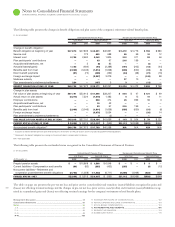
Defined Benefit Pension Plans Nonpension Postretirement Benefit Plans
U.S. Plans Non-U.S. Plans U.S. Plan Non-U.S. Plans
2008 2007 2008 2007 2008 2007 2008 2007
Net loss at January 1 $ 2,479 $ 7,286 $ 9,228 $11,504 $ 657 $ 935 $186 $247
Current period loss/(gain) 13,435 (4,105) 10,339 (1,342) (194) (254) (11) (44)
Curtailments and settlements — — (56) — — — (7) —
Amortization of net loss included in net
periodic (income)/cost (291) (703) (612) (934) (9) (24) (14) (17)
Net loss at December 31 $15,623 $ 2,479 $18,898 $ 9,228 $ 454 $ 657 $155 $186
Prior service costs/(credits) at January 1
$ (60) $ (3) $ (1,147) $ (1,323) $(115) $(177) $ (28) $ (35)
Current period prior service costs/(credits) 222 — — 51 — — — —
Curtailments and settlements — — 38 — — — — —
Amortization of prior service (costs)/credits
included in net periodic (income)/cost 7 (57) 129 125 62 62 7 8
Prior service costs/(credits) at December 31 $ 168 $ (60) $ (980) $ (1,147) $ (53) $(115) $ (21) $ (28)
Transition (assets)/liabilities at January 1 $ — $ — $ (1) $ (4) $ — $ — $ 1 $ 2
Amortization of transition assets/(liabilities)
included in net periodic (income)/cost — — 0 3 — — 0 (1)
Transition (assets)/liabilities at December 31 $ — $ — $ (1) $ (1) $ — $ — $ 1 $ 1
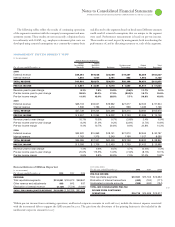
TOTAL LOSS RECOGNIZED IN ACCUMULATED
GAINS AND (LOSSES) NOT AFFECTING
RETAINED EARNINGS* $15,791 $ 2,418 $17,917 $ 8,080 $ 401 $ 542 $135 $160
* See note N, “Stockholders’ Equity Activity,” on page 96 for the total change in the accumulated gains and (losses) not affecting retained earnings and the Consolidated Statement of
Stockholders’ Equity for components of net periodic (income)/cost, including the related tax effects, recognized in gains and (losses) not affecting retained earnings for the company’s
retirement-related benefit plans.
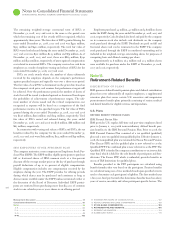
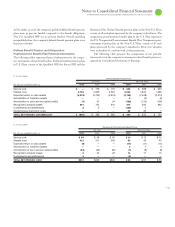
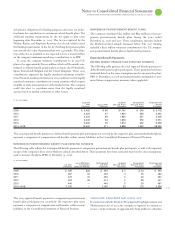
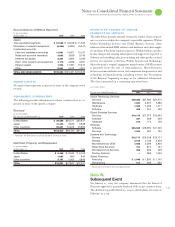
The following table presents the pre-tax estimated net loss, estimated prior service costs/(credits) and estimated transition (assets)/liabilities of
the company’s retirement-related benefit plans that will be amortized from accumulated gains and
(l
osses) not affecting retained earnings into
net periodic (income)/cost and recorded in the Consolidated Statement of Earnings in .
($ )
Defined Nonpension
Benefit Pension Plans Postretirement Benefit Plans
U.S. Plans Non-U.S. Plans U.S. Plan Non-U.S. Plans
Net loss $434 $ 703 $ — $10
Prior service costs/(credits) 9 (113) (39) (6)
Transition (assets)/liabilities — 0 — 0
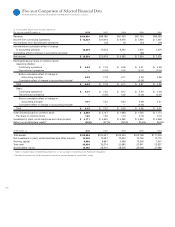
Assumptions Used to Determine Plan
Financial Information
Underlying both the measurement of benefit obligations and net
periodic (income)/cost are actuarial valuations. These valuations use
participant-specific information such as salary, age and years of ser-
vice, as well as certain assumptions, the most significant of which
include estimates of discount rates, expected return on plan assets,
rate of compensation increases, interest crediting rates and mortality
rates. The company evaluates these assumptions, at a minimum,
annually, and makes changes as necessary.
The table on page presents the assumptions used to measure
the net periodic (income)/cost and the year-end benefit obligations
for the retirement-related benefit plans.
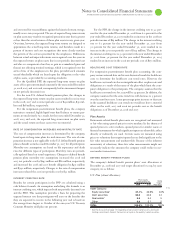
During the year ended December , , the IBM Board of Directors
approved a pension adjustment for certain U.S. retirees and benefi-
ciaries in the PPP. This adjustment provided a pension increase to
approximately , IBM retirees who retired before January , .
This adjustment resulted in an increase in the PBO of $ million
and had no impact on the net periodic (income)/cost.
During the year ended December , , the company termi-
nated one of its defined benefit pension plans in Japan that resulted
in a settlement gain of $ million recorded as part of the net
periodic (income)/cost and resulted in a decrease to the PBO of
$ million.
No significant amendments of the retirement-related benefit plans
occurred during the years ended December , and that
had a material effect on the Consolidated Statement of Earnings.