IBM 2008 Annual Report Download - page 28
Download and view the complete annual report
Please find page 28 of the 2008 IBM annual report below. You can navigate through the pages in the report by either clicking on the pages listed below, or by using the keyword search tool below to find specific information within the annual report.-
 1
1 -
2
-
3
-
4
-
5
-
6
-
7
-
8
-
9
-
10
-
11
-
12
-
13
-
14
-
15
-
16
-
17
-
 18
18 -
 19
19 -
 20
20 -
 21
21 -
 22
22 -
 23
23 -
 24
24 -
 25
25 -
 26
26 -
 27
27 -
 28
28 -
 29
29 -
 30
30 -
 31
31 -
 32
32 -
 33
33 -
 34
34 -
 35
35 -
 36
36 -
 37
37 -
 38
38 -
39
-
40
-
41
-
42
-
43
-
44
-
45
-
46
-
47
-
48
-
49
-
50
-
51
-
52
-
53
-
54
-
55
-
56
-
57
-
58
-
59
-
60
-
61
-
62
-
63
-
64
-
65
-
66
-
67
-
68
-
69
-
70
-
71
-
72
-
73
-
74
-
75
-
76
-
77
-
78
-
79
-
80
-
81
-
82
-
83
-
84
-
85
-
86
-
87
-
88
-
89
-
90
-
91
-
92
-
93
-
94
-
95
-
96
-
97
-
98
-
99
-
100
-
101
-
102
-
103
-
104
-
105
-
106
-
107
-
108
-
109
-
110
-
111
-
112
-
113
-
114
-
115
-
116
-
117
-
118
-
119
-
120
-
121
-
122
-
123
-
124
-
125
-
126
-
127
-
128
 |
 |

Management Discussion
INTERNATIONAL BUSINESS MACHINES CORPORATION and Subsidiary Companies
Management Discussion ................................................................................................18
ROAD MAP ............................................................................................................ 18
FORWARD-LOOKING AND CAUTIONARY STATEMENTS ...................................... 18
MANAGEMENT DISCUSSION SNAPSHOT ............................................................ 19
DESCRIPTION OF BUSINESS................................................................................20
YEAR IN REVIEW ..................................................................................................25
PRIOR YEAR IN REVIEW .......................................................................................39
DISCONTINUED OPERATIONS ................................................................................44
OTHER INFORMATION ..........................................................................................44
GLOBAL FINANCING .............................................................................................53
Report Of Management ............................................................................................... 58
Report Of Independent Registered Public Accounting Firm ................................. 59
Consolidated Statements ............................................................................................ 60
Notes ............................................................................................................................... 66
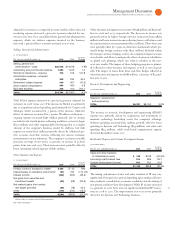
In , Global Services and Software increased as a percentage of total
segment revenue and total segment pre-tax income. Global Services
increased its revenue and profit contribution by . points and .
points, respectively, while the Software business increased by . points
and . points, respectively. These improvements reflect the compa-
ny’s portfolio actions and targeted investment strategies — both aimed
at market segments that present the best long-term opportunities.
GLOBAL SERVICES
The Global Services segments, Global Technology Services (GTS)
and Global Business Services (GBS), had combined revenue of
$, million, an increase of . percent ( percent adjusted for
currency) in when compared to . Revenue performance was
broad based across the segments, lines of business and geographic
units, driven primarily by a strong annuity base and growth in short-
term signings.
In , total Global Services signings increased percent year to
year to $, million ($, million adjusted for currency, flat
year to year). Short-term signings were $, million, an increase of
percent ( percent adjusted for currency) versus . Short-term
signings increased in both the growth markets and the major markets.
Long-term signings were $, million, a decrease of percent
( percent adjusted for currency) compared to . Long-term sign-
ings declined in both the major and growth markets. The total
Global Services backlog decreased $ billion from the prior year to
an estimated $ billion at December , .
The Global Services segments leveraged very strong margin
performance and delivered combined pre-tax profit of $, million
in , an improvement of . percent versus . The services
business contributed approximately percent of the company’s seg-
ment pre-tax profit in . Through its transformation initiatives,
the Global Services business has focused on higher value offerings
with a more flexible labor model that can adapt to changing market
environments.
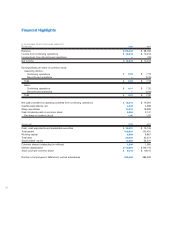
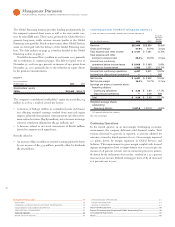
($ )
Yr.-to-Yr.
For the year ended December : 2008 2007 Change
GLOBAL SERVICES REVENUE: $58,891 $54,144 8.8%
Global Technology Services $39,264 $36,103 8.8%
Strategic Outsourcing 20,183 18,701 7.9
Integrated Technology Services 9,283 8,438 10.0
Business Transformation Outsourcing 2,550 2,294 11.2
Maintenance 7,250 6,670 8.7
Global Business Services $19,628 $18,041 8.8%
Global Technology Services revenue increased . percent ( percent
adjusted for currency) in versus with strong performance
across all lines of business. Total signings in GTS increased percent
(flat adjusted for currency) led by short-term signings growth of
percent ( percent adjusted for currency). Long-term signings
decreased percent ( percent adjusted for currency).
Strategic Outsourcing (SO) revenue was up . percent ( percent
adjusted for currency) with growth in all geographies, driven by prior
year’s signings and continued growth in the base accounts. SO sign-
ings in increased percent ( percent adjusted for currency)
when compared to . Signings were very strong in the fourth
quarter (up percent), as clients focused on the value of the SO
offerings in the current environment. The initiatives around stan-
dardization, global integration and improved efficiency are driving
improvements in quality and customer satisfaction which are reflected
in the signings performance and in improved profitability.
Information Technology Services (ITS) revenue increased .
percent ( percent adjusted for currency) in versus led
by growth in key infrastructure offerings such as Green Data Cen-
ter and Converged Communications. ITS infrastructure offerings
deliver high-value, standardized, asset-based services that leverage
the company’s services, hardware and software capabilities, providing
clients end-to-end solutions and processes that transform their busi-
nesses. ITS signings increased percent ( percent adjusted for
currency) in .
Business Transformation Outsourcing (BTO) revenue increased
. percent ( percent adjusted for currency) with growth in all
geographies, led by Asia Pacific. The Daksh business, which is focused
on business process outsourcing, delivered strong growth. BTO sign-
ings decreased percent ( percent adjusted for currency) in
compared to .
Maintenance revenue increased . percent ( percent adjusted
for currency) with growth in availability services on both IBM and
non-IBM IT equipment.
Global Business Services revenue increased . percent ( percent
adjusted for currency) in , with balanced growth across all three
geographies. Revenue performance was led by growth in Application
Management Services (. percent) and Core Consulting (. per-
cent). Total signings in GBS increased percent (decreased percent
adjusted for currency), led by a percent ( percent adjusted for
currency) growth in short-term signings. Short-term signings growth
was driven by offerings that enable clients to reduce cost and conserve
capital. In the second half of the year, signings for transformational
and compliance offerings also increased. Long-term signings decreased
percent ( percent adjusted for currency) year over year.