IBM 2008 Annual Report Download - page 21
Download and view the complete annual report
Please find page 21 of the 2008 IBM annual report below. You can navigate through the pages in the report by either clicking on the pages listed below, or by using the keyword search tool below to find specific information within the annual report.-
 1
1 -
2
-
3
-
4
-
5
-
6
-
7
-
8
-
9
-
10
-
 11
11 -
 12
12 -
 13
13 -
 14
14 -
 15
15 -
 16
16 -
 17
17 -
 18
18 -
 19
19 -
 20
20 -
 21
21 -
 22
22 -
 23
23 -
 24
24 -
 25
25 -
 26
26 -
 27
27 -
 28
28 -
 29
29 -
 30
30 -
 31
31 -
32
-
33
-
34
-
35
-
36
-
37
-
38
-
39
-
40
-
41
-
42
-
43
-
44
-
45
-
46
-
47
-
48
-
49
-
50
-
51
-
52
-
53
-
54
-
55
-
56
-
57
-
58
-
59
-
60
-
61
-
62
-
63
-
64
-
65
-
66
-
67
-
68
-
69
-
70
-
71
-
72
-
73
-
74
-
75
-
76
-
77
-
78
-
79
-
80
-
81
-
82
-
83
-
84
-
85
-
86
-
87
-
88
-
89
-
90
-
91
-
92
-
93
-
94
-
95
-
96
-
97
-
98
-
99
-
100
-
101
-
102
-
103
-
104
-
105
-
106
-
107
-
108
-
109
-
110
-
111
-
112
-
113
-
114
-
115
-
116
-
117
-
118
-
119
-
120
-
121
-
122
-
123
-
124
-
125
-
126
-
127
-
128
 |
 |

Management Discussion
INTERNATIONAL BUSINESS MACHINES CORPORATION and Subsidiary Companies
•
•
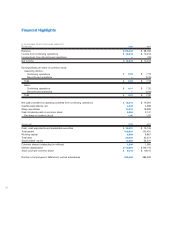
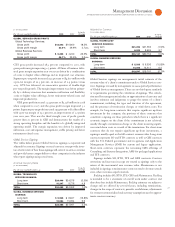
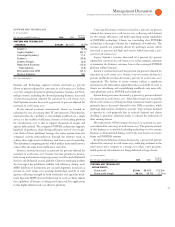
Management Discussion Snapshot
($ )
Yr.-to -Yr.
Percent/
Margin
For the year ended December : 2008 2007 Change
Revenue $103,630 $ 98,786 4.9%*
Gross profit margin 44.1% 42.2% 1.8 pts.
Total expense and other income $ 28,945 $ 27,240 6.3%
Total expense and other
income-to-revenue ratio 27.9% 27.6% 0.4 pts.
Income from continuing
operations before income taxes $ 16,715 $ 14,489 15.4%
Provision for income taxes 4,381 4,071 7.6%
Income from continuing
operations $ 12,334 $ 10,418 18.4%
Net income $ 12,334 $ 10,418 18.4%
Net income margin 11.9% 10.5% 1.4 pts.
Earnings per share of
common stock:
Assuming dilution:
Continuing operations $ 8.93 $ 7.18 24.4%
Discontinued operations —(0.00) NM
Total $ 8.93 $ 7.18 24.4%
Weighted-average shares
outstanding:
Assuming dilution 1,381.8 1,450.6 (4.7)%
Assets** $109,524 $120,431 (9.1)%
Liabilities** $ 96,058 $ 91,962 4.5%
Equity** $ 13,465 $ 28,470 (52.7)%
* 2.3 percent adjusted for currency.
** At December 31.
NM—Not meaningful
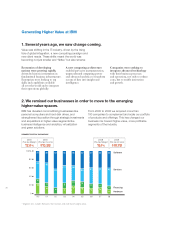
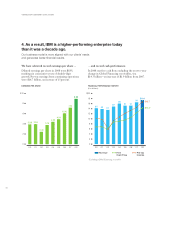
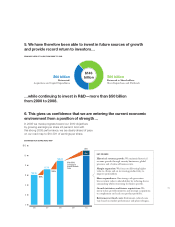
In , the company performed extremely well in a difficult econ-
omic environment, delivering record levels of revenue, pre-tax profit,
earnings per share and cash flow from operations. The financial per-
formance reflected the continuing strength of the company’s global
model and the results of the ongoing transformation of the business.
The key elements of the company’s transformation include:
• A continuing shift to higher value businesses;
• Investing for growth in the emerging markets;
• Global integration;
• Investing in innovation; and
•
Ongoing productivity resulting in higher profit margins.
Overall, the company capitalized on the opportunities in the global
economies, generating approximately percent of its revenue outside
the United States (U.S.), in delivering full year growth of . percent
( percent adjusted for currency). Revenue increased in all geogra-
phies, both on an as reported basis and adjusted for currency — the
revenue performance, adjusted for currency, was stable throughout
the year as the company focused on solutions that meet clients’ needs.
Revenue from the company’s growth markets organization increased
. percent ( percent adjusted for currency). In these markets,
where the growth is driven by the infrastructure build-out, the com-
pany invested aggressively to capture these opportunities. For the full
year and in the fourth quarter, growth in these markets, adjusted for
currency, was points greater than the major markets.
Gross profit margins improved, reflecting the shift to higher
value businesses, pricing for value and the continued focus on pro-
ductivity and cost management. Pre-tax income from continuing
operations grew . percent and net income from continuing
operations increased . percent reflecting an improvement in the
company’s tax rate. Diluted earnings per share improved . percent
reflecting the strong growth in net income and the benefits of the
common stock repurchase program. In , the company repur-
chased approximately million shares of its common stock.
The increase in revenue was primarily due to:
• Continued strong performance from Global Technology Services
and Global Business Services with growth in all business lines and
geographic units;
• Continued strong demand in the Software business, driven by Key
Branded Middleware products, with strong contributions from
strategic acquisitions; and
• Continued strength in the growth markets.
The increase in income from continuing operations before income
taxes in was primarily due to the revenue growth and gross profit
margin improvements in the Global Services and Software segments.
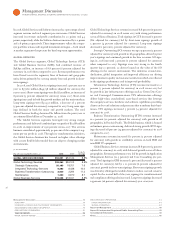
The consolidated gross profit margin increased . points versus
to . percent. Gross margin performance by segment and the
impact to the consolidated gross margin was as follows:
Gross Yr.-to-Yr. Consolidated
Margin Change Impact
Global Technology Services 32.6% 2.7 pts. 0.8 pts.
Global Business Services 26.7% 3.2 pts. 0.5 pts.
Software 85.4% 0.2 pts. 0.5 pts.
Systems & Technology 38.1% (1.7) pts. (0.2) pts.
Global Financing 51.3% 4.6 pts. 0.1 pts.