IBM 2008 Annual Report Download - page 86
Download and view the complete annual report
Please find page 86 of the 2008 IBM annual report below. You can navigate through the pages in the report by either clicking on the pages listed below, or by using the keyword search tool below to find specific information within the annual report.-
 1
1 -
2
-
3
-
4
-
5
-
6
-
7
-
8
-
9
-
10
-
11
-
12
-
13
-
14
-
15
-
16
-
17
-
18
-
19
-
20
-
21
-
22
-
23
-
24
-
25
-
26
-
27
-
28
-
29
-
30
-
31
-
32
-
33
-
34
-
35
-
36
-
37
-
38
-
39
-
40
-
41
-
42
-
43
-
44
-
45
-
46
-
47
-
48
-
49
-
50
-
51
-
52
-
53
-
54
-
55
-
56
-
57
-
58
-
59
-
60
-
61
-
62
-
63
-
64
-
65
-
66
-
67
-
68
-
69
-
70
-
71
-
72
-
73
-
74
-
75
-
 76
76 -
 77
77 -
 78
78 -
 79
79 -
 80
80 -
 81
81 -
 82
82 -
 83
83 -
 84
84 -
 85
85 -
 86
86 -
 87
87 -
 88
88 -
 89
89 -
 90
90 -
 91
91 -
 92
92 -
 93
93 -
 94
94 -
 95
95 -
 96
96 -
97
-
98
-
99
-
100
-
101
-
102
-
103
-
104
-
105
-
106
-
107
-
108
-
109
-
110
-
111
-
112
-
113
-
114
-
115
-
116
-
117
-
118
-
119
-
120
-
121
-
122
-
123
-
124
-
125
-
126
-
127
-
128
 |
 |

Notes to Consolidated Financial Statements
INTERNATIONAL BUSINESS MACHINES CORPORATION and Subsidiary Companies
Management Discussion ............................................................................................. 18
Consolidated Statements ............................................................................................ 60
Notes ............................................................................................................................... 66
A – E ........................................................................................................................66
A. SIGNIFICANT ACCOUNTING POLICIES ...........................................................66
B. ACCOUNTING CHANGES .................................................................................76
C. ACQUISITIONS/DIVESTITURES ........................................................................78
D. FAIR VALUE ......................................................................................................84
E. FINANCIAL INSTRUMENTS (EXCLUDING DERIVATIVES)................................85
F – J ........................................................................................................................86
K– Q .......................................................................................................................88
R –W ..................................................................................................................... 10 2
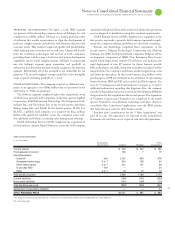
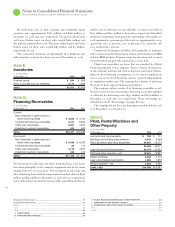
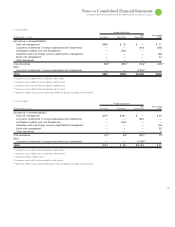
Note D.
Fair Value
The following table presents the company’s financial assets and financial liabilities that are measured at fair value on a recurring basis at
December , consistent with the fair value hierarchy provisions of SFAS No. .
($ )
For the year ended December : Level 1 Level 2 Level 3 Netting(1) Total
Assets:
Cash and cash equivalents $1,950 $ 8,059 $ — $ — $10,009
Marketable securities — 166 — — 166
Derivative assets(2) 56 1,834 — (875) 1,015
Investments and sundry assets 165 6 — — 171
TOTAL ASSETS $2,171 $10,065 $ — $(875) $11,361
Liabilities:
Derivative liabilities(3) $ — $ 2,116 $ — $(875) $ 1,241
TOTAL LIABILITIES $ — $ 2,116 $ — $(875) $ 1,241
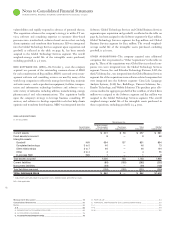
(1) Represents netting of derivative exposures covered by a qualifying master netting agreement in accordance with FASB Interpretation No. 39, “Offsetting of Amounts Relating to Certain
Contracts,” and credit risk adjustments, if material.
(2)
The gross balances of derivative assets contained within prepaid expenses and other current assets, and investments and sundry assets in the Consolidated Statement of Financial
Position at December 31, 2008 are $773 million and $1,117 million, respectively.
(3) The gross balances of derivative liabilities contained within other accrued expenses and liabilities, and other liabilities in the Consolidated Statement of Financial Position at December
31, 2008 are $1,414 million and $702 million, respectively.
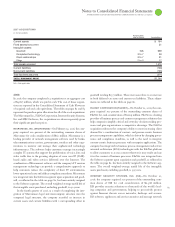
At December , , the company did not have any assets or liabilities measured at fair value on a recurring basis using significant unobservable
inputs (Level ) in the Consolidated Statement of Financial Position.
In the fourth quarter, the company recorded an other-than-tempo-
rary impairment of $ million for an equity method investment.
The resulting investment which is classified as Level in the fair
value hierarchy was valued using a discounted cash flow model. The
valuation inputs included an estimate of future cash flows, expecta-
tions about possible variations in the amount and timing of cash
flows and a discount rate based on the risk-adjusted cost of capital.
Potential results were assigned probabilities that resulted in a
weighted average or most-likely discounted cash flow fair value as of
December , . The fair value of the investment after impair-
ment was $ million at December , .