IBM 2008 Annual Report Download - page 15
Download and view the complete annual report
Please find page 15 of the 2008 IBM annual report below. You can navigate through the pages in the report by either clicking on the pages listed below, or by using the keyword search tool below to find specific information within the annual report.-
 1
1 -
2
-
3
-
4
-
 5
5 -
 6
6 -
 7
7 -
 8
8 -
 9
9 -
 10
10 -
 11
11 -
 12
12 -
 13
13 -
 14
14 -
 15
15 -
 16
16 -
 17
17 -
 18
18 -
 19
19 -
 20
20 -
 21
21 -
 22
22 -
 23
23 -
 24
24 -
 25
25 -
26
-
27
-
28
-
29
-
30
-
31
-
32
-
33
-
34
-
35
-
36
-
37
-
38
-
39
-
40
-
41
-
42
-
43
-
44
-
45
-
46
-
47
-
48
-
49
-
50
-
51
-
52
-
53
-
54
-
55
-
56
-
57
-
58
-
59
-
60
-
61
-
62
-
63
-
64
-
65
-
66
-
67
-
68
-
69
-
70
-
71
-
72
-
73
-
74
-
75
-
76
-
77
-
78
-
79
-
80
-
81
-
82
-
83
-
84
-
85
-
86
-
87
-
88
-
89
-
90
-
91
-
92
-
93
-
94
-
95
-
96
-
97
-
98
-
99
-
100
-
101
-
102
-
103
-
104
-
105
-
106
-
107
-
108
-
109
-
110
-
111
-
112
-
113
-
114
-
115
-
116
-
117
-
118
-
119
-
120
-
121
-
122
-
123
-
124
-
125
-
126
-
127
-
128
 |
 |
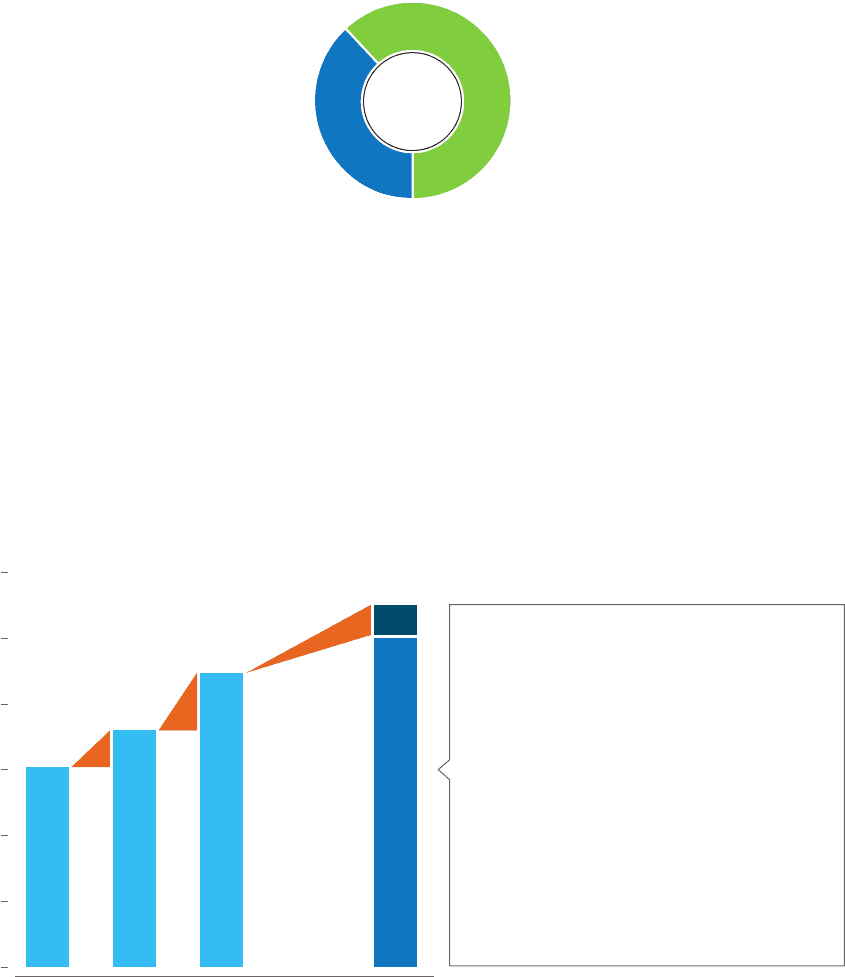
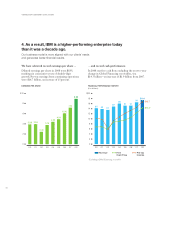
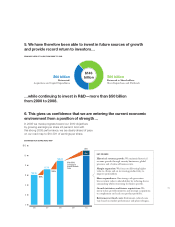
5. We have therefore been able to invest in future sources of growth
and provide record return to investors …
…while continuing to invest in R&D—more than $50 billion
from 2000 to 2008.
PRIMARY USES OF CASH FROM 2000 TO 2008
6. This gives us confidence that we are entering the current economic
environment from a position of strength…
In 2008 we made progress toward our 2010 objectives
by growing earnings per share 24 percent. And with
this strong 2008 performance, we are clearly ahead of pace
on our road map to $10
–
$11 of earnings per share.
KEY DRIVERS
Historical revenue growth: We maintain historical
revenue growth through annuity businesses, global
presence and a balanced business mix.
Margin expansion: We focus on delivering higher
value to clients and on increasing productivity, to
improve protability.
Share repurchases: Our strong cash generation
lets us return value to shareholders by reducing shares
outstanding while reinvesting for future growth.
Growth initiatives and future acquisitions: We
invest in key growth initiatives and strategic acquisitions
to complement and scale our product portfolio.
Retirement-related costs: Retirement-related costs
vary based on market performance and plan redesigns.
$6.06
07
$7.18
08
$8.93
10
$10
$11
09
18%
24%
6%-11%
Compound
Annual Growth
Rate
$12
10
6
2
8
4
0
06
Reinvested:
Acquisitions and Capital Expenditures
Returned to Shareholders:
Share Repurchases and Dividends
$60 billion
$146
billion $86 billion
EARNINGS PER SHARE ROAD MAP