IBM 2008 Annual Report Download - page 119
Download and view the complete annual report
Please find page 119 of the 2008 IBM annual report below. You can navigate through the pages in the report by either clicking on the pages listed below, or by using the keyword search tool below to find specific information within the annual report.-
 1
1 -
2
-
3
-
4
-
5
-
6
-
7
-
8
-
9
-
10
-
11
-
12
-
13
-
14
-
15
-
16
-
17
-
18
-
19
-
20
-
21
-
22
-
23
-
24
-
25
-
26
-
27
-
28
-
29
-
30
-
31
-
32
-
33
-
34
-
35
-
36
-
37
-
38
-
39
-
40
-
41
-
42
-
43
-
44
-
45
-
46
-
47
-
48
-
49
-
50
-
51
-
52
-
53
-
54
-
55
-
56
-
57
-
58
-
59
-
60
-
61
-
62
-
63
-
64
-
65
-
66
-
67
-
68
-
69
-
70
-
71
-
72
-
73
-
74
-
75
-
76
-
77
-
78
-
79
-
80
-
81
-
82
-
83
-
84
-
85
-
86
-
87
-
88
-
89
-
90
-
91
-
92
-
93
-
94
-
95
-
96
-
97
-
98
-
99
-
100
-
101
-
102
-
103
-
104
-
105
-
106
-
107
-
108
-
 109
109 -
 110
110 -
 111
111 -
 112
112 -
 113
113 -
 114
114 -
 115
115 -
 116
116 -
 117
117 -
 118
118 -
 119
119 -
 120
120 -
 121
121 -
 122
122 -
 123
123 -
 124
124 -
 125
125 -
 126
126 -
 127
127 -
 128
128
 |
 |

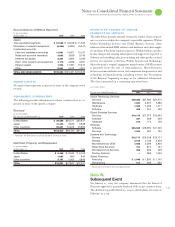
Notes to Consolidated Financial Statements
INTERNATIONAL BUSINESS MACHINES CORPORATION and Subsidiary Companies
($ )
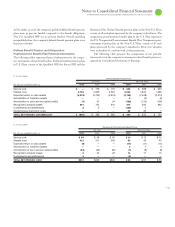
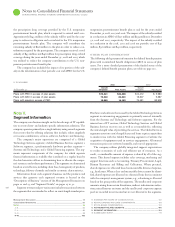
Global Services Segments
Global Global
Technology Business Systems and Global Total
For the year ended December : Services Services Software Technology Financing Segments
2008:
External revenue $39,264 $19,628 $22,089 $ 19,287 $2,559 $102,827
Internal revenue 1,546 1,044 2,761 882 1,892 8,125
TOTAL REVENUE $40,810 $20,671 $24,850 $20,169 $4,451 $110,951
PRE-TAX INCOME $ 4,607 $ 2,681 $ 7,075 $ 1,550 $1,617 $ 17,531
Revenue year-to-year change 8.1% 7.5% 10.9% (9.6)% 11.7% 5.0%
Pre-tax income year-to-year change 29.5% 29.9% 17.9% (28.0)% 16.7% 15.6%
Pre-tax income margin 11.3% 13.0% 28.5% 7.7% 36.3% 15.8%
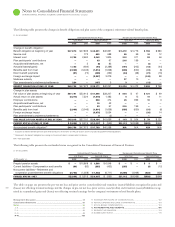
2007:
External revenue $36,103 $18,041 $19,982 $21,317 $2,502 $ 97,944
Internal revenue 1,636 1,193 2,416 998 1,482 7,726
TOTAL REVENUE $37,739 $19,234 $22,398 $22,315 $3,984 $105,670
PRE-TAX INCOME $ 3,557 $ 2,064 $ 6,002 $ 2,153 $1,386 $ 15,163
Revenue year-to-year change 10.7% 10.9% 9.7% (3.6)% 2.4% 6.9%
Pre-tax income year-to-year change 8.2% 21.0% 9.3% 23.8% (4.7)% 10.8%
Pre-tax income margin 9.4% 10.7% 26.8% 9.6% 34.8% 14.3%
2006:
External revenue $32,322 $15,969 $18,161 $ 21,970 $2,365 $ 90,787
Internal revenue 1,763 1,373 2,249 1,168 1,527 8,080
TOTAL REVENUE $34,086 $17,341 $20,409 $23,138 $3,892 $ 98,867
PRE-TAX INCOME $ 3,288 $ 1,706 $ 5,493 $ 1,739 $1,455 $ 13,682
Revenue year-to-year change 1.4% 0.6% 8.5% 4.7% (0.4)% 0.3%
Pre-tax income year-to-year change 25.6% 116.9% 14.9% (7.6)% (8.1)% 19.1%
Pre-tax income margin 9.6% 9.8% 26.9% 7.5% 37.4% 13.8%
Reconciliations of IBM as Reported
($ )
For the year ended December : 2008 2007 2006
REVENUE:
Total reportable segments $110,951 $105,670 $98,867
Other revenue and adjustments 803 842 637
Elimination of internal revenue (8,125) (7,726) (8,080)
TOTAL IBM CONSOLIDATED REVENUE $103,630 $ 98,786 $91,424
($ )
For the year ended December : 2008 2007 2006
PRE-TAX INCOME:
Total reportable segments $17,531 $15,163 $13,682
Elimination of internal transactions (433) (194) (171)
Unallocated corporate amounts (382) (480) (194)
TOTAL IBM CONSOLIDATED PRE-TAX
INCOME FROM CONTINUING
OPERATIONS $16,715 $14,489 $13,317
The following tables reflect the results of continuing operations
of the segments consistent with the company’s management and mea-
surement system. These results are not necessarily a depiction that is
in conformity with GAAP; e.g., employee retirement plan costs are
developed using actuarial assumptions on a country-by-country basis
and allocated to the segments based on headcount. Different amounts
could result if actuarial assumptions that are unique to the segment
were used. Performance measurement is based on pre-tax income.
These results are used, in part, by management, both in evaluating the
performance of, and in allocating resources to, each of the segments.
Within pre-tax income from continuing operations, unallocated corporate amounts in and include the interest expense associated
with the incremental debt to support the ASR executed in . The gain from the divestiture of the printing business is also included in the
unallocated corporate amount for .