IBM 2008 Annual Report Download - page 106
Download and view the complete annual report
Please find page 106 of the 2008 IBM annual report below. You can navigate through the pages in the report by either clicking on the pages listed below, or by using the keyword search tool below to find specific information within the annual report.-
 1
1 -
2
-
3
-
4
-
5
-
6
-
7
-
8
-
9
-
10
-
11
-
12
-
13
-
14
-
15
-
16
-
17
-
18
-
19
-
20
-
21
-
22
-
23
-
24
-
25
-
26
-
27
-
28
-
29
-
30
-
31
-
32
-
33
-
34
-
35
-
36
-
37
-
38
-
39
-
40
-
41
-
42
-
43
-
44
-
45
-
46
-
47
-
48
-
49
-
50
-
51
-
52
-
53
-
54
-
55
-
56
-
57
-
58
-
59
-
60
-
61
-
62
-
63
-
64
-
65
-
66
-
67
-
68
-
69
-
70
-
71
-
72
-
73
-
74
-
75
-
76
-
77
-
78
-
79
-
80
-
81
-
82
-
83
-
84
-
85
-
86
-
87
-
88
-
89
-
90
-
91
-
92
-
93
-
94
-
95
-
 96
96 -
 97
97 -
 98
98 -
 99
99 -
 100
100 -
 101
101 -
 102
102 -
 103
103 -
 104
104 -
 105
105 -
 106
106 -
 107
107 -
 108
108 -
 109
109 -
 110
110 -
 111
111 -
 112
112 -
 113
113 -
 114
114 -
 115
115 -
 116
116 -
117
-
118
-
119
-
120
-
121
-
122
-
123
-
124
-
125
-
126
-
127
-
128
 |
 |

Notes to Consolidated Financial Statements
INTERNATIONAL BUSINESS MACHINES CORPORATION and Subsidiary Companies
Management Discussion ............................................................................................. 18
Consolidated Statements ............................................................................................ 60
Notes ............................................................................................................................... 66
A – E ........................................................................................................................66
F – J ........................................................................................................................86
K– Q .......................................................................................................................88
R –W ..................................................................................................................... 102
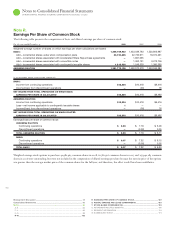
R. EARNINGS PER SHARE OF COMMON STOCK .............................................. 102
S. RENTAL EXPENSE AND LEASE COMMITMENTS ........................................... 10 3
T. STOCK-BASED COMPENSATION .................................................................. 103
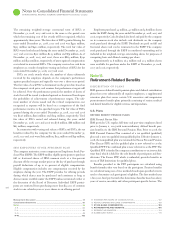
U. RETIREMENT-RELATED BENEFITS ................................................................. 106
V. SEGMENT INFORMATION .............................................................................. 116
W. SUBSEQUENT EVENT .................................................................................... 119
low market price on the date of grant. The options approval process
specifies the individual receiving the grant, the number of options or
the value of the award, the exercise price or formula for determining
the exercise price and the date of grant. All awards for senior manage-
ment are approved by the Committee. All awards for employees
other than senior management are approved by senior management
pursuant to a series of delegations that were approved by the
Committee, and the grants made pursuant to these delegations are
reviewed periodically with the Committee. Awards that are given as
part of annual total compensation for senior management and other
employees are made on specific cycle dates scheduled in advance.
With respect to awards given in connection with promotions or new
hires, the company’s policy requires approval of such awards prior to
the grant date, which is typically the date of the promotion or the
date of hire. The exercise price of these options is the average of the
high and low market price on the date of grant.
Stock Options
Stock options are awards which allow the employee to purchase
shares of the company’s stock at a fixed price. Stock options are
granted at an exercise price equal to or greater than the company
stock price on the date of grant. These awards, which generally vest
percent per year, are fully vested four years from the date of grant
and have a contractual term of ten years. The company also had a
stock-based program under the Plans for its senior executives,
designed to drive improved performance and increase the ownership
executives have in the company. These executives had the opportu-
nity to receive at-the-money stock options by agreeing to defer a
certain percentage of their annual incentive compensation into IBM
equity, where it is held for three years or until retirement. In ,
this program was expanded to cover all executives of the company.
Options under this program become fully vested three years from
the date of grant and have a contractual term of ten years. The plan
element permitting executives to defer annual incentive compensa-
tion into IBM equity and receive at-the-money stock options was
terminated at December , .
The company estimates the fair value of stock options using the
Black-Scholes valuation model, consistent with the provisions of
SFAS No. (R), “Share-Based Payment” (SFAS No. (R)) and
SAB No. . Key inputs and assumptions used to estimate the fair
value of stock options include the grant price of the award, the
expected option term, volatility of the company’s stock, the risk-free
rate and the company’s dividend yield. Estimates of fair value are not
intended to predict actual future events or the value ultimately real-
ized by employees who receive equity awards, and subsequent events
are not indicative of the reasonableness of the original estimates of
fair value made by the company.
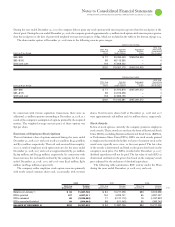
The fair value of each stock option grant was estimated at the date
of grant using a Black-Scholes option pricing model. The following
table presents the weighted-average assumptions used in the valuation
and the resulting weighted-average fair value per option granted.
For the year ended December : 2008+ 2007 2006
Option term (years)* — 5 5
Volatility ** — 23.1% 26.2%
Risk-free interest rate (zero
coupon U.S. treasury note) — 4.5% 4.9%
Dividend yield — 1.4% 1.3%
Weighted-average fair value
per option granted — $26 $23
+ During the year ended December 31, 2008, the company did not grant stock options.
* The option term is the number of years that the company estimates, based upon history,
that options will be outstanding prior to exercise or forfeiture.
** The company’s estimates of expected volatility are principally based on daily price
changes of the company’s stock over the expected option term, as well as the additional
requirements included in the provisions of SFAS No. 123(R) and the guidance provided
by SAB No. 107.
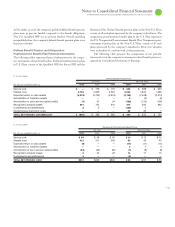
The following table summarizes option activity under the Plans during the years ended December , , and .
2008 2007 2006
Wtd. Avg. No. of Shares Wtd. Avg. No. of Shares Wtd. Avg. No. of Shares
Exercise Price Under Option Exercise Price Under Option Exercise Price Under Option
Balance at January 1 $100 157,661,257 $ 95 207,663,223 $ 91 236,070,040
Options granted — — 103 1,087,381 85 2,013,623
Options exercised 91 (36,282,000) 77 (46,961,380) 53 (21,685,948)
Options canceled/expired 109 (2,072,087) 106 (4,127,967) 100 (8,734,492)
BALANCE AT DECEMBER 31 $102 119,307,170 $100 157,661,257 $ 95 207,663,223
EXERCISABLE AT DECEMBER 31 $102 114,445,381 $100 144,092,169 $ 95 177,318,905