IBM 2008 Annual Report Download - page 36
Download and view the complete annual report
Please find page 36 of the 2008 IBM annual report below. You can navigate through the pages in the report by either clicking on the pages listed below, or by using the keyword search tool below to find specific information within the annual report.
Management Discussion
INTERNATIONAL BUSINESS MACHINES CORPORATION and Subsidiary Companies
Management Discussion ................................................................................................18
ROAD MAP ............................................................................................................ 18
FORWARD-LOOKING AND CAUTIONARY STATEMENTS ...................................... 18
MANAGEMENT DISCUSSION SNAPSHOT ............................................................ 19
DESCRIPTION OF BUSINESS................................................................................ 20
YEAR IN REVIEW ..................................................................................................25
PRIOR YEAR IN REVIEW .......................................................................................39
DISCONTINUED OPERATIONS ..............................................................................44
OTHER INFORMATION ..........................................................................................44
GLOBAL FINANCING .............................................................................................53
Report Of Management ............................................................................................... 58
Report Of Independent Registered Public Accounting Firm ................................. 59
Consolidated Statements ............................................................................................ 60
Notes ............................................................................................................................... 66
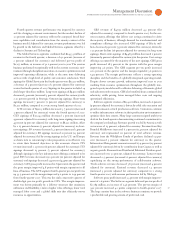
WORKING CAPITAL
($ )
At December : 2008 2007
Current assets $49,004 $53,177
Current liabilities 42,435 44,310
WORKING CAPITAL $ 6,568 $ 8,867
Current ratio 1.15 1.20
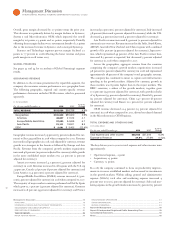
Working capital decreased $, million compared to the prior year
primarily as a result of a net decrease in current assets. The key drivers
are described below:
Current assets decreased $, million due to:
• A decrease of $, million in cash and cash equivalents and
marketable securities (see Cash Flow analysis below and on
page );
• A decrease of $, million in short-term receivables driven by
currency impacts of $, million;
Partially offset by:
• An increase of $ million in prepaid expenses and other current
assets primarily resulting from:
– an increase of $ million in prepaid taxes;
– an increase of $ million in derivative assets primarily due
to changes in foreign currency rates for certain economic
hedges; and
– approximately $ million negative currency impact.
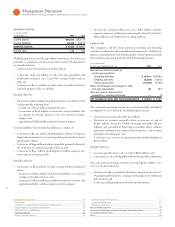
Current liabilities decreased $, million as a result of:
• A decrease of $, million (including $ million of negative
impact due to currency) in accounts payable primarily due to lower
purchasing volumes;
• A decrease of $ million in short-term debt primarily driven by
the reduction in commercial paper balances; and
• A decrease of $ million (including $ million negative cur-
rency impact) in taxes payable;
Partially offset by:
• An increase of $ million in other accrued liabilities primarily
due to:
– an increase of $ million in derivative liabilities as a result of
changes in foreign currency rates;
– an increase of $ million in workforce reduction accruals; and
– approximately $ million negative currency impact.
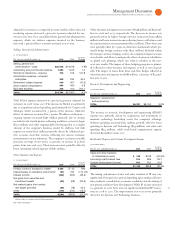
• An increase of $ million (net of a $ million negative
currency impact) in deferred income mainly driven by Software
($ million) and Global Services ($ million).
CASH FLOW
The company’s cash flow from operating, investing and financing
activities, as reflected in the Consolidated Statement of Cash Flows on
page , is summarized in the following table. These amounts include
the cash flows associated with the Global Financing business.
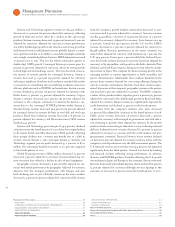
($ )
For the year ended December : 2008 2007
Net cash provided by/(used in)
continuing operations:
Operating activities $ 18,812 $16,094
Investing activities (9,285) (4,675)
Financing activities (11,834) (4,740)
Effect of exchange rate changes on cash
and cash equivalents 58 294
Net cash used in discontinued
operations — operating activities — (5)
NET CHANGE IN CASH AND CASH EQUIVALENTS $ (2,250) $ 6,969
Net cash from operating activities for increased $, million
as compared to driven by the following key factors:
• An increase in net income of $, million;
• Decreases in accounts receivable drove an increase in cash of
$, million, driven by Global Financing receivables ($,
million) and non-Global Financing receivables ($ million)
primarily resulting from reduced fourth-quarter revenue
and im proved collections; and
• A decrease year to year in retirement-related plan funding of
$ million;
Partially offset by:
• Accounts payable drove a use of cash of $ million; and
• A decrease in cash of $ million driven by growth in inventory.
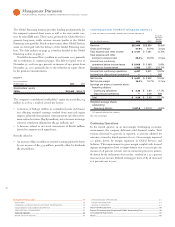
Net cash used in investing activities increased $, million on a
year-to-year basis driven by:
• An increase of $, million utilized for acquisitions (see note C,
“Acquisi tions/Divestitures,” on pages through for additional
information); and
• A decrease of $ million received from divestitures;


