IBM 2008 Annual Report Download - page 58
Download and view the complete annual report
Please find page 58 of the 2008 IBM annual report below. You can navigate through the pages in the report by either clicking on the pages listed below, or by using the keyword search tool below to find specific information within the annual report.-
 1
1 -
2
-
3
-
4
-
5
-
6
-
7
-
8
-
9
-
10
-
11
-
12
-
13
-
14
-
15
-
16
-
17
-
18
-
19
-
20
-
21
-
22
-
23
-
24
-
25
-
26
-
27
-
28
-
29
-
30
-
31
-
32
-
33
-
34
-
35
-
36
-
37
-
38
-
39
-
40
-
41
-
42
-
43
-
44
-
45
-
46
-
47
-
 48
48 -
 49
49 -
 50
50 -
 51
51 -
 52
52 -
 53
53 -
 54
54 -
 55
55 -
 56
56 -
 57
57 -
 58
58 -
 59
59 -
 60
60 -
 61
61 -
 62
62 -
 63
63 -
 64
64 -
 65
65 -
 66
66 -
 67
67 -
 68
68 -
69
-
70
-
71
-
72
-
73
-
74
-
75
-
76
-
77
-
78
-
79
-
80
-
81
-
82
-
83
-
84
-
85
-
86
-
87
-
88
-
89
-
90
-
91
-
92
-
93
-
94
-
95
-
96
-
97
-
98
-
99
-
100
-
101
-
102
-
103
-
104
-
105
-
106
-
107
-
108
-
109
-
110
-
111
-
112
-
113
-
114
-
115
-
116
-
117
-
118
-
119
-
120
-
121
-
122
-
123
-
124
-
125
-
126
-
127
-
128
 |
 |

Management Discussion
INTERNATIONAL BUSINESS MACHINES CORPORATION and Subsidiary Companies
Management Discussion ................................................................................................18
ROAD MAP ............................................................................................................ 18
FORWARD-LOOKING AND CAUTIONARY STATEMENTS ...................................... 18
MANAGEMENT DISCUSSION SNAPSHOT ............................................................ 19
DESCRIPTION OF BUSINESS................................................................................20
YEAR IN REVIEW ...................................................................................................25
PRIOR YEAR IN REVIEW ....................................................................................... 39
DISCONTINUED OPERATIONS ..............................................................................44
OTHER INFORMATION ..........................................................................................44
GLOBAL FINANCING ............................................................................................53
Report Of Management ............................................................................................... 58
Report Of Independent Registered Public Accounting Firm ................................. 59
Consolidated Statements ............................................................................................ 60
Notes ............................................................................................................................... 66
of the equipment to be returned at end of lease. These third-party
guarantees are included in minimum lease payments as provided for
by accounting standards in the determination of lease classifications
for the covered equipment and provide protection against risk of
loss arising from declines in equipment values for these assets. The
residual value guarantee increases the minimum lease payments that
are utilized in determining the classification of a lease as a sales-type
lease or an operating lease. The aggregate asset values associated with
the guarantees were $, million and $ million for financing
transactions originated during the years ended December ,
and , respectively. In , the residual value guarantee program
resulted in the company recognizing approximately $ million of
revenue that would otherwise have been recognized in future periods
as operating lease revenue. If the company had chosen to not par-
ticipate in a residual value program in and prior years, the
impact would be substantially mitigated by the effect of prior year
asset values being recognized as operating lease revenue in the cur-
rent year. The associated aggregate guaranteed future values at the
scheduled end of lease were $ million and $ million for financing
transactions originated during the same time periods, respectively.
The cost of guarantees was $ million for the year ended December
, , and $ million for the year ended December , .
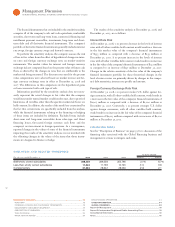
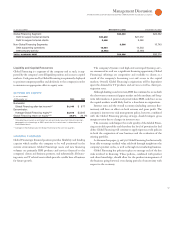
Debt
At December : 2008 2007
Debt-to-equity ratio 7.0x 7.1x
The company funds Global Financing through borrowings using a
debt-to-equity ratio target of approximately to . The debt used to
fund Global Financing assets is composed of intercompany loans and
external debt. The terms of the intercompany loans are set by the
company to substantially match the term and currency underlying
the financing receivable and are based on arm’s-length pricing. Both
assets and debt are presented in the Global Financing balance sheet
on page .
The Global Financing business provides funding predominantly
for the company’s external clients but also provides intercompany
financing for the company, as described in the “Description of Business”
on page . As previously stated, the company measures Global
Financing as if it were a standalone entity and accordingly, interest
expense relating to debt supporting Global Financing’s external client
and internal business is included in the “Global Finan cing Results of
Operations” on pages and and in note V, “Segment Information,”
on pages to .
In the company’s Consolidated Statement of Earnings on page
, however, the external debt-related interest expense supporting
Global Financing’s internal financing to the company is reclassified
from cost of financing to interest expense.
The table on page provides additional information on total
company debt. In this table, intercompany activity is comprised of
internal loans and leases at arm’s length pricing in support of Global
Services’ long-term contracts and other internal activity. The com-
pany believes these assets should be appropriately levered in line with
the overall Global Financing business model.
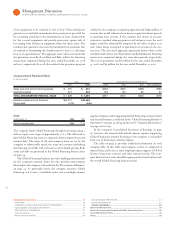
Unguaranteed Residual Value
($ )
Total Estimated Run Out of 2008 Balance
2007 2008 2009 2010 2011 2012 and Beyond
Sales-type and direct financing leases $ 915 $ 916 $208 $255 $268 $185
Operating leases 421 378 139 120 85 34
TOTAL UNGUARANTEED RESIDUAL VALUE $ 1,336 $ 1,294 $347 $375 $353 $219
Related original amount financed $24,517 $23,165
Percentage 5.4% 5.6%