IBM 2008 Annual Report Download - page 44
Download and view the complete annual report
Please find page 44 of the 2008 IBM annual report below. You can navigate through the pages in the report by either clicking on the pages listed below, or by using the keyword search tool below to find specific information within the annual report.-
 1
1 -
2
-
3
-
4
-
5
-
6
-
7
-
8
-
9
-
10
-
11
-
12
-
13
-
14
-
15
-
16
-
17
-
18
-
19
-
20
-
21
-
22
-
23
-
24
-
25
-
26
-
27
-
28
-
29
-
30
-
31
-
32
-
33
-
 34
34 -
 35
35 -
 36
36 -
 37
37 -
 38
38 -
 39
39 -
 40
40 -
 41
41 -
 42
42 -
 43
43 -
 44
44 -
 45
45 -
 46
46 -
 47
47 -
 48
48 -
 49
49 -
 50
50 -
 51
51 -
 52
52 -
 53
53 -
 54
54 -
55
-
56
-
57
-
58
-
59
-
60
-
61
-
62
-
63
-
64
-
65
-
66
-
67
-
68
-
69
-
70
-
71
-
72
-
73
-
74
-
75
-
76
-
77
-
78
-
79
-
80
-
81
-
82
-
83
-
84
-
85
-
86
-
87
-
88
-
89
-
90
-
91
-
92
-
93
-
94
-
95
-
96
-
97
-
98
-
99
-
100
-
101
-
102
-
103
-
104
-
105
-
106
-
107
-
108
-
109
-
110
-
111
-
112
-
113
-
114
-
115
-
116
-
117
-
118
-
119
-
120
-
121
-
122
-
123
-
124
-
125
-
126
-
127
-
128
 |
 |

Management Discussion
INTERNATIONAL BUSINESS MACHINES CORPORATION and Subsidiary Companies
Management Discussion ................................................................................................18
ROAD MAP ............................................................................................................ 18
FORWARD-LOOKING AND CAUTIONARY STATEMENTS ...................................... 18
MANAGEMENT DISCUSSION SNAPSHOT ............................................................ 19
DESCRIPTION OF BUSINESS................................................................................ 20
YEAR IN REVIEW ...................................................................................................25
PRIOR YEAR IN REVIEW ......................................................................................39
DISCONTINUED OPERATIONS ..............................................................................44
OTHER INFORMATION ..........................................................................................44
GLOBAL FINANCING .............................................................................................53
Report Of Management ............................................................................................... 58
Report Of Independent Registered Public Accounting Firm ................................. 59
Consolidated Statements ............................................................................................ 60
Notes ............................................................................................................................... 66
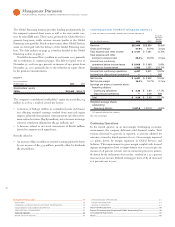
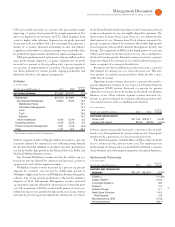
Systems and Technology segment revenue decreased . percent
( percent adjusted for currency). On June , , the company
completed the divestiture of its printing business to Ricoh. This
resulted in the loss of approximately $ million of Systems and
Technology revenue in when compared to . Systems and
Tech nology revenue, excluding the printing business, was flat
(declined
percent adjusted for currency) in versus .
System z revenue decreased . percent ( percent adjusted for
currency). System z MIPS shipments increased percent. System z
revenue declined in the second half of following a long and suc-
cessful technology cycle of over two-and-a-half years. Converged
System p revenue increased . percent ( percent adjusted for cur-
rency). The increase was primarily driven by strength in midrange
POWER+ and POWER servers, which increased percent.
Legacy System i revenue decreased . percent ( percent adjusted
for currency). Although legacy System i revenue declined year over
year, fourth-quarter revenue increased percent with growth in
POWER servers which were introduced late in the third quarter of
. System x revenue increased . percent ( percent adjusted for
currency). Revenue performance was driven by System x server
products which grew percent and System x blades which increased
percent in versus . System Storage revenue increased
. percent ( percent adjusted for currency). The increase was pri-
marily driven by percent growth in tape products, while external
disk products increased percent. Enterprise tape products had
strong double-digit revenue growth, while midrange tape products
had mid single-digit revenue growth. Retail Store Solutions revenue
increased . percent ( percent adjusted for currency) primarily
due to the continued roll out of new programmable point-of-sale
solutions to large retail clients.
Microelectronics OEM revenue decreased . percent driven
by reduced demand for game processors. Printing Systems revenue
decreased as a result of the divestiture of the business. The
results included five months of revenue while the results
included months of revenue.
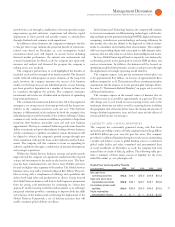
($ )
Yr.-to -Yr.
For the year ended December : 2007 2006 Change
SYSTEMS AND TECHNOLOGY
GROSS PROFIT:
Gross profit $8,468 $8,284 2.2%
Gross profit margin 39.7% 37.7% 2.0
pts.
The increase in Systems and Technology gross profit dollars was
primarily due to higher gross profit margins in System z, converged
System p and System x servers. The Systems and Technology gross
profit
margin increased . points to . percent. Converged
System p performance contributed . points to the overall margin
improvement, while System z and System x contributed . points
and . points, respectively. These increases were partially offset by
lower gross margins in legacy System i of . points and System
Storage of . points.
Systems and Technology segment pre-tax margin expanded
. points to . percent driven primarily by a strong combination of
operational cost management and the value that virtualization has
driven in the enterprise space.
Global Financing
See pages and for a discussion of the Global Financing segment.
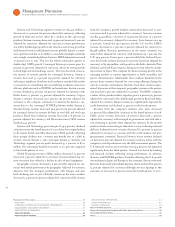
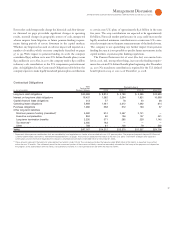
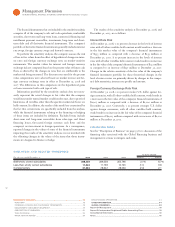
Geographic Revenue
($ )
Yr.-to -Yr.
For the year ended December : 2007 2006 Change
TOTAL REVENUE: $98,786 $91,424 8.1%
Geographies: $95,320 $87,564 8.9%
Americas 41,122 39,511 4.1
Europe/Middle East/Africa 34,699 30,491 13.8
Asia Pacific 19,501 17,566 11.0
OEM $ 3,465 $ 3,856 (10.1)%
From a geographic perspective, revenue increased in all geographies
in when compared to . Adjusted for currency, revenue
growth was led by Asia Pacific and steady performance throughout
the year in EMEA.
Americas revenue increased . percent ( percent adjusted for
currency) in . Revenue increased in all regions with the U.S. up
. percent, Canada . percent ( percent adjusted for currency) and
Latin America . percent ( percent adjusted for currency).
EMEA revenue increased . percent ( percent adjusted for
currency) in when compared to . Within the European
market, IT spending grew at a moderate rate, and the company’s
mid single-digit revenue growth rates throughout reflected
that environment. Revenue increased in all major countries with
Spain up . percent ( percent adjusted for currency), Germany
. percent ( percent adjusted for currency), the U.K. . percent
( percent adjusted for currency), France . percent ( percent
adjusted for currency) and Italy . percent (decreased percent
adjusted for currency).