IBM 2008 Annual Report Download - page 29
Download and view the complete annual report
Please find page 29 of the 2008 IBM annual report below. You can navigate through the pages in the report by either clicking on the pages listed below, or by using the keyword search tool below to find specific information within the annual report.-
 1
1 -
2
-
3
-
4
-
5
-
6
-
7
-
8
-
9
-
10
-
11
-
12
-
13
-
14
-
15
-
16
-
17
-
18
-
 19
19 -
 20
20 -
 21
21 -
 22
22 -
 23
23 -
 24
24 -
 25
25 -
 26
26 -
 27
27 -
 28
28 -
 29
29 -
 30
30 -
 31
31 -
 32
32 -
 33
33 -
 34
34 -
 35
35 -
 36
36 -
 37
37 -
 38
38 -
 39
39 -
40
-
41
-
42
-
43
-
44
-
45
-
46
-
47
-
48
-
49
-
50
-
51
-
52
-
53
-
54
-
55
-
56
-
57
-
58
-
59
-
60
-
61
-
62
-
63
-
64
-
65
-
66
-
67
-
68
-
69
-
70
-
71
-
72
-
73
-
74
-
75
-
76
-
77
-
78
-
79
-
80
-
81
-
82
-
83
-
84
-
85
-
86
-
87
-
88
-
89
-
90
-
91
-
92
-
93
-
94
-
95
-
96
-
97
-
98
-
99
-
100
-
101
-
102
-
103
-
104
-
105
-
106
-
107
-
108
-
109
-
110
-
111
-
112
-
113
-
114
-
115
-
116
-
117
-
118
-
119
-
120
-
121
-
122
-
123
-
124
-
125
-
126
-
127
-
128
 |
 |

Management Discussion
INTERNATIONAL BUSINESS MACHINES CORPORATION and Subsidiary Companies
($ )
Yr.-to-Yr.
For the year ended December : 2008 2007 Change
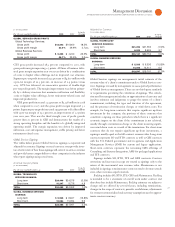
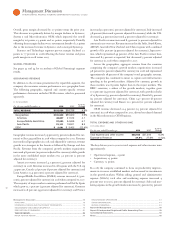
GLOBAL SERVICES GROSS PROFIT:
Global Technology Services:
Gross profit $12,802 $10,800 18.5%
Gross profit margin 32.6% 29.9% 2.7 pts.
Global Business Services:
Gross profit $ 5,238 $ 4,240 23.5%
Gross profit margin 26.7% 23.5% 3.2 pts.
GTS gross profit increased . percent compared to , with
gross profit margin improving . points. All lines of business deliv-
ered gross margin expansion year over year driven by a combination
of a mix to higher value offerings and an improved cost structure.
Segment pre-tax profit increased . percent to $, million with
a pre-tax margin of . percent, an increase of . points versus
. GTS has delivered six consecutive quarters of double-digit
pre-tax profit growth. The margin improvement was driven primar-
ily by a delivery structure that maximizes utilization and flexibility,
a mix to higher value offerings, lower retirement-related costs and
improved productivity.
GBS gross profit increased . percent to $, million in
when compared to , and the gross profit margin improved .
points. Segment pre-tax profit increased . percent to $, million
with a pre-tax margin of . percent, an improvement of . points
year over year. This was the third straight year of profit growth
greater than percent in GBS and demonstrates the results of a
strong operating discipline and the benefits of a globally integrated
operating model. The margin expansion was driven by improved
utilization, cost and expense management, stable pricing and lower
retirement-related costs.
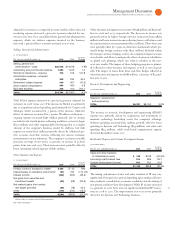
Global Services Signings
The tables below present Global Services signings as reported and
adjusted for currency. Signings at actual currency rates provide inves-
tors a better view of how these signings will convert to services revenue
and provide better comparability to other companies in the industry
who report signings using actual rates.
At Actual Currency Rates
($ )
Yr.-to-Yr.
For the year ended December : 2008 2007 Change
GLOBAL TECHNOLOGY
SERVICES SIGNINGS:
Long term $24,446 $24,576 (0.5)%
Short term 10,247 9,776 4.8
TOTAL $34,693 $34,352 1.0%
GLOBAL BUSINESS SERVICES
SIGNINGS:
Long term $ 5,905 $ 6,847 (13.8)%
Short term 16,584 15,094 9.9
TOTAL $22,488 $21,941 2.5%
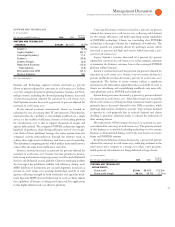
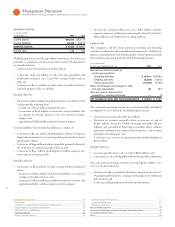
Adjusted for Currency
($ )
Yr.-to-Yr.
For the year ended December : 2008 2007 Change
GLOBAL TECHNOLOGY
SERVICES SIGNINGS:
Long term $21,220 $21,550 (1.5)%
Short term 8,920 8,604 3.7
TOTAL $30,141 $30,154 0.0%
GLOBAL BUSINESS SERVICES
SIGNINGS:
Long term $ 5,333 $ 6,330 (15.8)%
Short term 14,264 13,411 6.4
TOTAL $19,597 $19,741 (0.7)%
Global Services signings are management’s initial estimate of the
revenue value of a client’s commitment under a Global Services con-
tract. Signings are used by management to assess period performance
of Global Services management. There are no third-party standards
or requirements governing the calculation of signings. The calcula-
tion used by management includes an approximation of currency and
involves estimates and judgments to gauge the extent of a client’s
commitment, including the type and duration of the agreement,
and the presence of termination charges or wind-down costs. For
example, for long-term contracts that require significant up-front
investment by the company, the portions of these contracts that
constitute a signing are those periods in which there is a significant
economic impact on the client if the commitment is not achieved,
usually through a termination charge or the client incurring signifi-
cant wind-down costs as a result of the termination. For short-term
contracts that do not require significant up-front investments, a
signing is usually equal to the full contract revenue value. Long-term
contracts represent SO and BTO contracts as well as GBS contracts
with the U.S. Federal government and its agencies and Application
Management Services (AMS) for custom and legacy applications.
Short-term contracts represent the remaining GBS offerings of
Consulting and Systems Integration, AMS for packaged applications
and ITS contracts.
Signings include SO, BTO, ITS and GBS contracts. Contract
extensions and increases in scope are treated as signings only to the
extent of the incremental new revenue value. Maintenance is not
included in signings as maintenance contracts tend to be more steady
state, where revenues equal renewals.
Backlog includes SO, BTO, ITS, GBS and Maintenance. Backlog
is intended to be a statement of overall work under contract and
therefore does include Maintenance. Backlog estimates are subject to
change and are affected by several factors, including terminations,
changes in the scope of contracts, periodic revalidations, adjustments
for revenue not materialized and currency assumptions used to approx-
imate constant currency.