IBM 2008 Annual Report Download - page 110
Download and view the complete annual report
Please find page 110 of the 2008 IBM annual report below. You can navigate through the pages in the report by either clicking on the pages listed below, or by using the keyword search tool below to find specific information within the annual report.-
 1
1 -
2
-
3
-
4
-
5
-
6
-
7
-
8
-
9
-
10
-
11
-
12
-
13
-
14
-
15
-
16
-
17
-
18
-
19
-
20
-
21
-
22
-
23
-
24
-
25
-
26
-
27
-
28
-
29
-
30
-
31
-
32
-
33
-
34
-
35
-
36
-
37
-
38
-
39
-
40
-
41
-
42
-
43
-
44
-
45
-
46
-
47
-
48
-
49
-
50
-
51
-
52
-
53
-
54
-
55
-
56
-
57
-
58
-
59
-
60
-
61
-
62
-
63
-
64
-
65
-
66
-
67
-
68
-
69
-
70
-
71
-
72
-
73
-
74
-
75
-
76
-
77
-
78
-
79
-
80
-
81
-
82
-
83
-
84
-
85
-
86
-
87
-
88
-
89
-
90
-
91
-
92
-
93
-
94
-
95
-
96
-
97
-
98
-
99
-
 100
100 -
 101
101 -
 102
102 -
 103
103 -
 104
104 -
 105
105 -
 106
106 -
 107
107 -
 108
108 -
 109
109 -
 110
110 -
 111
111 -
 112
112 -
 113
113 -
 114
114 -
 115
115 -
 116
116 -
 117
117 -
 118
118 -
 119
119 -
 120
120 -
121
-
122
-
123
-
124
-
125
-
126
-
127
-
128
 |
 |

Notes to Consolidated Financial Statements
INTERNATIONAL BUSINESS MACHINES CORPORATION and Subsidiary Companies
Management Discussion ............................................................................................. 18
Consolidated Statements ............................................................................................ 60
Notes ............................................................................................................................... 66
A – E ........................................................................................................................66
F – J ........................................................................................................................86
K– Q .......................................................................................................................88
R –W ..................................................................................................................... 102
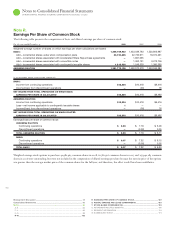
R. EARNINGS PER SHARE OF COMMON STOCK .............................................. 102
S. RENTAL EXPENSE AND LEASE COMMITMENTS ........................................... 103
T. STOCK-BASED COMPENSATION ................................................................... 103
U. RETIREMENT-RELATED BENEFITS ............................................................... 10 6
V. SEGMENT INFORMATION .............................................................................. 116
W. SUBSEQUENT EVENT .................................................................................... 119
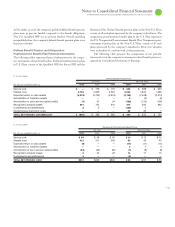
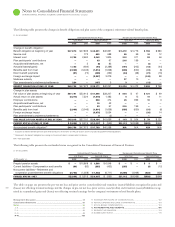
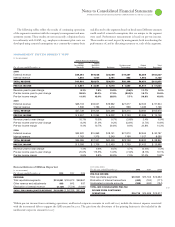
Summary of Financial Information
The following table presents a summary of the total retirement-related benefits net periodic (income)/cost recorded in the Consolidated
Statement of Earnings.
($ )
U.S. Plans Non-U.S. Plans Total
For the year ended December : 2008 2007* 2006* 2008 2007* 2006* 2008 2007* 2006*
Defined benefit pension plans $ (948) $ 473 $ 549 $380 $ 822 $ 724 $ (568) $1,295 $1,273
Retention Plan 13 23 20 —— — 13 23 20
Total defined benefit pension plans (income)/cost $ (936) $ 496 $ 569 $380 $ 822 $ 724 $ (556) $1,318 $1,293
IBM 401(k) Plus Plan and Non-U.S. plans $1,034 $ 390 $ 358 $540 $ 478 $ 377 $1,574 $ 868 $ 735
Excess 401(k) 36 12 11 —— — 36 12 11
Total defined contribution plans cost $1,069 $ 402 $ 370 $540 $ 478 $ 377 $1,609 $ 880 $ 747
Nonpension postretirement benefit plans cost $ 310 $ 342 $ 335 $ 53 $ 57 $ 53 $ 363 $ 399 $ 388
TOTAL RETIREMENT-RELATED
BENEFITS NET PERIODIC COST $ 443 $1,240 $1,274 $973 $1,357 $1,154 $1,416 $2,597 $2,428
* Reclassified to conform with 2008 presentation.
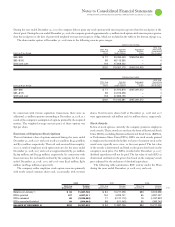
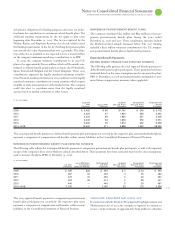
The following table presents a summary of the total projected benefit obligation (PBO) for defined benefit plans, accumulated postretirement
benefit obligation (APBO) for nonpension postretirement benefit plans (benefit obligations), fair value of plan assets and the associated funded
status recorded in the Consolidated Statement of Financial Position.
($ )
Benefit Fair Value
Obligations of Plan Assets Funded Status*
At December : 2008 2007** 2008 2007** 2008 2007**
U.S. Plans:
Overfunded plans:
Qualified PPP $ —$46,323 $ — $57,191 $ — $ 10,868
Underfunded plans:
Qualified PPP $47,297 $ — $45,918 $ — $ (1,379) $ —
Excess PPP 1,224 1,135 —— (1,224) (1,135)
Retention Plan 235 215 —— (235) (215)
Nonpension postretirement benefit plan 5,224 5,472 113 504 (5,111) (4,968)
Total underfunded U.S. plans $53,980 $ 6,822 $46,031 $ 504 $ (7,949) $ (6,318)
Non-U.S. Plans:
Overfunded plans:
Qualified defined benefit pension plans
$12,586 $29,168 $14,183 $35,716 $ 1,598 $ 6,548
Nonpension postretirement benefit plans 12 — 14 — 3—
Total overfunded non-U.S. plans $12,598 $29,168 $14,197 $35,716 $ 1,601 $ 6,548
Underfunded plans:
Qualified defined benefit pension plans
$21,179 $ 7,437 $14,980 $ 5,980 $ (6,199) $ (1,457)
Nonqualified defined benefit pension plans 5,406 5,686 —— (5,406) (5,686)
Nonpension postretirement benefit plans 596 769 65 121 (532) (648)
Total underfunded non-U.S. plans $27,182 $13,892 $15,045 $ 6,101 $(12,137) $ (7,791)
TOTAL OVERFUNDED PLANS $12,598 $75,491 $14,197 $92,908 $ 1,601 $ 17,417
TOTAL UNDERFUNDED PLANS $81,162 $20,714 $61,076 $ 6,605 $(20,086) $(14,109)
* Funded status is recognized in the Consolidated Statement of Financial Position as follows: Asset amounts as prepaid pension assets; (Liability) amounts as compensation and
benefits (current liability) and retirement and nonpension postretirement benefit obligations (noncurrent liability).
** Reclassified to conform with 2008 presentation.