IBM 2008 Annual Report Download - page 64
Download and view the complete annual report
Please find page 64 of the 2008 IBM annual report below. You can navigate through the pages in the report by either clicking on the pages listed below, or by using the keyword search tool below to find specific information within the annual report.-
 1
1 -
2
-
3
-
4
-
5
-
6
-
7
-
8
-
9
-
10
-
11
-
12
-
13
-
14
-
15
-
16
-
17
-
18
-
19
-
20
-
21
-
22
-
23
-
24
-
25
-
26
-
27
-
28
-
29
-
30
-
31
-
32
-
33
-
34
-
35
-
36
-
37
-
38
-
39
-
40
-
41
-
42
-
43
-
44
-
45
-
46
-
47
-
48
-
49
-
50
-
51
-
52
-
53
-
 54
54 -
 55
55 -
 56
56 -
 57
57 -
 58
58 -
 59
59 -
 60
60 -
 61
61 -
 62
62 -
 63
63 -
 64
64 -
 65
65 -
 66
66 -
 67
67 -
 68
68 -
 69
69 -
 70
70 -
 71
71 -
 72
72 -
 73
73 -
 74
74 -
75
-
76
-
77
-
78
-
79
-
80
-
81
-
82
-
83
-
84
-
85
-
86
-
87
-
88
-
89
-
90
-
91
-
92
-
93
-
94
-
95
-
96
-
97
-
98
-
99
-
100
-
101
-
102
-
103
-
104
-
105
-
106
-
107
-
108
-
109
-
110
-
111
-
112
-
113
-
114
-
115
-
116
-
117
-
118
-
119
-
120
-
121
-
122
-
123
-
124
-
125
-
126
-
127
-
128
 |
 |

Management Discussion ............................................................................................. 18
Report Of Management ............................................................................................... 58
Report Of Independent Registered Public Accounting Firm ................................. 59
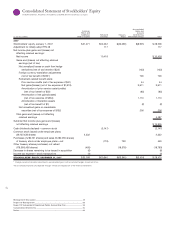
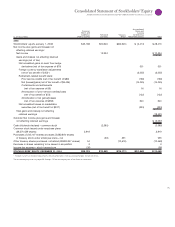
Consolidated Statements ............................................................................................ 60
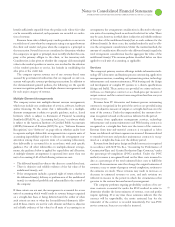
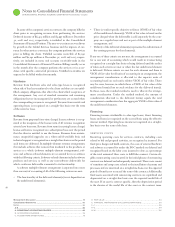
Notes ............................................................................................................................... 66
Consolidated Statement of Cash Flows
INTERNATIONAL BUSINESS MACHINES CORPORATION and Subsidiary Companies
($ )
For the year ended December : 2008 2007 2006
CASH FLOW FROM OPERATING ACTIVITIES FROM CONTINUING OPERATIONS:
Net income $ 12,334 $ 10,418 $ 9,492
(Income)/loss from discontinued operations —00 (76)
Adjustments to reconcile income from continuing operations
to cash provided by operating activities:
Depreciation 4,140 4,038 3,907
Amortization of intangibles 1,310 1,163 1,076
Stock-based compensation 659 713 846
Deferred taxes 1,900 740 1,724
Net gain on asset sales and other (338) (89) (175)
Change in operating assets and liabilities, net of acquisitions/divestitures:
Receivables (including financing receivables) 274 (1,408) (512)
Retirement related (1,773) (228) (850)
Inventories (102) 182 112
Other assets/other liabilities 1,268 706 (881)
Accounts payable (860) (142) 355
NET CASH PROVIDED BY OPERATING ACTIVITIES FROM CONTINUING OPERATIONS 18,812 16,094 15,019
CASH FLOW FROM INVESTING ACTIVITIES FROM CONTINUING OPERATIONS:
Payments for plant, rental machines and other property (4,171) (4,630) (4,362)
Proceeds from disposition of plant, rental machines and other property 350 537 430
Investment in software (716) (875) (804)
Purchases of marketable securities and other investments* (4,590) (24,117) (23,530)
Proceeds from disposition of marketable securities and other investments* 6,100 24,984 20,533
Non-operating finance receivables — net* (16) 125 (18)
Divestiture of businesses, net of cash transferred 71 310 —
Acquisition of businesses, net of cash acquired (6,313) (1,009) (3,799)
NET CASH USED IN INVESTING ACTIVITIES FROM CONTINUING OPERATIONS (9,285) (4,675) (11,549)
CASH FLOW FROM FINANCING ACTIVITIES FROM CONTINUING OPERATIONS:
Proceeds from new debt 13,829 21,744 1,444
Short-term (repayments)/borrowings less than 90 days — net (6,025) 1,674 1,834
Payments to settle debt (10,248) (11,306) (3,400)
Common stock repurchases (10,578) (18,828) (8,084)
Common stock transactions — other 3,774 4,123 1,685
Cash dividends paid (2,585) (2,147) (1,683)
NET CASH USED IN FINANCING ACTIVITIES FROM CONTINUING OPERATIONS (11,834) (4,740) (8,204)
Effect of exchange rate changes on cash and cash equivalents 58 294 201
Net cash used in discontinued operations from: Operating activities —(5) (12)
Net change in cash and cash equivalents (2,250) 6,969 (4,546)
Cash and cash equivalents at January 1 14,991 8,022 12,568
CASH AND CASH EQUIVALENTS AT DECEMBER 31 $ 12,741 $ 14,991 $ 8,022
SUPPLEMENTAL DATA:
Income taxes paid — net of refunds received $ 2,111 $ 2,608 $ 2,068
Interest paid on debt $ 1,460 $ 1,485 $ 1,202
Capital lease obligations $ 41 $ 57 $ 36
* Non-operating finance receivables—net represents cash flows from short-term commercial financing arrangements (terms generally 30 to 90 days) with dealers and remarketers of
predominantly non-IBM products. Amounts previously presented gross within purchases/proceeds of marketable securities and other investments.
The accompanying notes on pages 66 through 119 are an integral part of the financial statements.