IBM 2008 Annual Report Download - page 122
Download and view the complete annual report
Please find page 122 of the 2008 IBM annual report below. You can navigate through the pages in the report by either clicking on the pages listed below, or by using the keyword search tool below to find specific information within the annual report.-
 1
1 -
2
-
3
-
4
-
5
-
6
-
7
-
8
-
9
-
10
-
11
-
12
-
13
-
14
-
15
-
16
-
17
-
18
-
19
-
20
-
21
-
22
-
23
-
24
-
25
-
26
-
27
-
28
-
29
-
30
-
31
-
32
-
33
-
34
-
35
-
36
-
37
-
38
-
39
-
40
-
41
-
42
-
43
-
44
-
45
-
46
-
47
-
48
-
49
-
50
-
51
-
52
-
53
-
54
-
55
-
56
-
57
-
58
-
59
-
60
-
61
-
62
-
63
-
64
-
65
-
66
-
67
-
68
-
69
-
70
-
71
-
72
-
73
-
74
-
75
-
76
-
77
-
78
-
79
-
80
-
81
-
82
-
83
-
84
-
85
-
86
-
87
-
88
-
89
-
90
-
91
-
92
-
93
-
94
-
95
-
96
-
97
-
98
-
99
-
100
-
101
-
102
-
103
-
104
-
105
-
106
-
107
-
108
-
109
-
110
-
111
-
 112
112 -
 113
113 -
 114
114 -
 115
115 -
 116
116 -
 117
117 -
 118
118 -
 119
119 -
 120
120 -
 121
121 -
 122
122 -
 123
123 -
 124
124 -
 125
125 -
 126
126 -
 127
127 -
 128
128
 |
 |

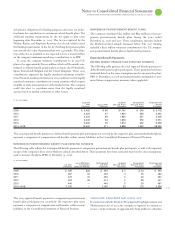
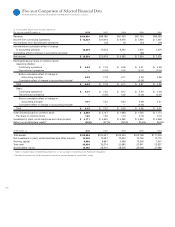
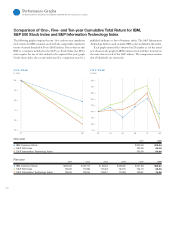
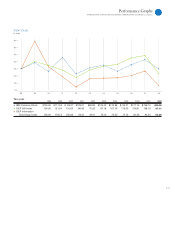
Five-year Comparison of Selected Financial Data
INTERNATIONAL BUSINESS MACHINES CORPORATION and Subsidiary Companies
($ )
For the year ended December : 2008 2007 2006 2005 2004
Revenue $103,630 $98,786 $91,424 $91,134 $96,293
Income from continuing operations $ 12,334 $10,418 $ 9,416 $ 7,994 $ 7,497
Income/(loss) from discontinued operations —(00) 76 (24) (18)
Income before cumulative effect of change
in accounting principle 12,334 10,418 9,492 7,970 7,479
Cumulative effect of change in accounting principle* —— — (36) —
Net income $ 12,334 $10,418 $ 9,492 $ 7,934 $ 7,479
Earnings/(loss) per share of common stock:
Assuming dilution:
Continuing operations $ 8.93 $ 7.18 $ 6.06 $ 4.91 $ 4.39
Discontinued operations —(0.00) 0.05 (0.01) (0.01)
Before cumulative effect of change in
accounting principle 8.93 7.18 6.11 4.90 4.38
Cumulative effect of change in accounting principle* —— — (0.02) —
Total $ 8.93 $ 7.18 $ 6.11 $ 4.87 $ 4.38
Basic:
Continuing operations $ 9.07 $ 7.32 $ 6.15 $ 4.99 $ 4.48
Discontinued operations —(0.00) 0.05 (0.02) (0.01)
Before cumulative effect of change in
accounting principle 9.07 7.32 6.20 4.98 4.47
Cumulative effect of change in accounting principle* —— — (0.02) —
Total $ 9.07 $ 7.32 $ 6.20 $ 4.96 $ 4.47
Cash dividends paid on common stock $ 2,585 $ 2,147 $ 1,683 $ 1,250 $ 1,174
Per share of common stock 1.90 1.50 1.10 0.78 0.70
Investment in plant, rental machines and other property $ 4,171 $ 4,630 $ 4,362 $ 3,842 $ 4,368
Return on stockholders’ equity** 48.8% 42.7% 29.3% 25.6% 25.6%
At December : 2008 2007 2006 2005 2004
Total assets $109,524 $120,431 $103,234 $105,748 $111,003
Net investment in plant, rental machines and other property 14,305 15,081 14,440 13,756 15,175
Working capital 6,568 8,867 4,569 10,509 7,357
Total debt 33,926 35,274 22,682 22,641 22,927
Stockholders’ equity 13,465 28,470 28,506 33,098 31,688
* Reflects implementation of FASB Interpretation No. 47, “Accounting for Conditional Asset Retirement Obligations.”
** Restated to conform with 2008 presentation using a five-quarter average for stockholders’ equity.