IBM 2008 Annual Report Download - page 42
Download and view the complete annual report
Please find page 42 of the 2008 IBM annual report below. You can navigate through the pages in the report by either clicking on the pages listed below, or by using the keyword search tool below to find specific information within the annual report.-
 1
1 -
2
-
3
-
4
-
5
-
6
-
7
-
8
-
9
-
10
-
11
-
12
-
13
-
14
-
15
-
16
-
17
-
18
-
19
-
20
-
21
-
22
-
23
-
24
-
25
-
26
-
27
-
28
-
29
-
30
-
31
-
 32
32 -
 33
33 -
 34
34 -
 35
35 -
 36
36 -
 37
37 -
 38
38 -
 39
39 -
 40
40 -
 41
41 -
 42
42 -
 43
43 -
 44
44 -
 45
45 -
 46
46 -
 47
47 -
 48
48 -
 49
49 -
 50
50 -
 51
51 -
 52
52 -
53
-
54
-
55
-
56
-
57
-
58
-
59
-
60
-
61
-
62
-
63
-
64
-
65
-
66
-
67
-
68
-
69
-
70
-
71
-
72
-
73
-
74
-
75
-
76
-
77
-
78
-
79
-
80
-
81
-
82
-
83
-
84
-
85
-
86
-
87
-
88
-
89
-
90
-
91
-
92
-
93
-
94
-
95
-
96
-
97
-
98
-
99
-
100
-
101
-
102
-
103
-
104
-
105
-
106
-
107
-
108
-
109
-
110
-
111
-
112
-
113
-
114
-
115
-
116
-
117
-
118
-
119
-
120
-
121
-
122
-
123
-
124
-
125
-
126
-
127
-
128
 |
 |

Management Discussion
INTERNATIONAL BUSINESS MACHINES CORPORATION and Subsidiary Companies
Management Discussion ................................................................................................18
ROAD MAP ............................................................................................................ 18
FORWARD-LOOKING AND CAUTIONARY STATEMENTS ...................................... 18
MANAGEMENT DISCUSSION SNAPSHOT ............................................................ 19
DESCRIPTION OF BUSINESS................................................................................ 20
YEAR IN REVIEW ...................................................................................................25
PRIOR YEAR IN REVIEW ......................................................................................39
DISCONTINUED OPERATIONS ..............................................................................44
OTHER INFORMATION ..........................................................................................44
GLOBAL FINANCING .............................................................................................53
Report Of Management ............................................................................................... 58
Report Of Independent Registered Public Accounting Firm ................................. 59
Consolidated Statements ............................................................................................ 60
Notes ............................................................................................................................... 66
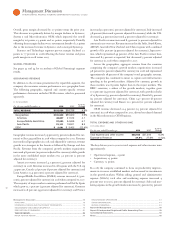
The increase in revenue was primarily due to:
• Strong performance from Global Technology Services and Global
Business Services with growth in all business lines;
• Continued strong demand in the Software business, driven by Key
Branded Middleware products, with strong contributions from
strategic acquisitions; and
• Continued growth in emerging countries (Brazil, Russia, India
and China: up percent) and solid performance in all geogra-
phies, led by Asia Pacific.
The increase in income from continuing operations before income
taxes in was primarily due to the revenue growth and gross profit
margin improvements in the Global Services and Systems and Tech-
nology segments.
The following is an analysis of the versus reportable
segment results for Global Services, Systems and Technology and
Software. The Global Financing segment analysis is included in the
Global Financing section on pages through .
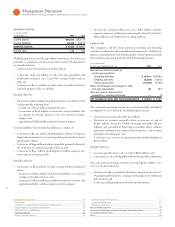
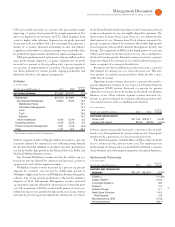
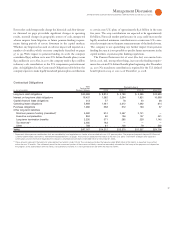
Global Services
($ )
Yr.-to -Yr.
For the year ended December : 2007 2006 Change
GLOBAL SERVICES REVENUE: $54,144 $48,291 12.1%
Global Technology Services: $36,103 $32,322 11.7%
Strategic Outsourcing 18,701 17,044 9.7
Integrated Technology Services 8,438 7,448 13.3
Maintenance 6,670 5,986 11.4
Business Transformation
Outsourcing 2,294 1,845 24.4
Global Business Services $18,041 $15,969 13.0%
The Global Services segments, GTS and GBS had combined revenue
of $, million, an increase of . percent ( percent adjusted for
currency) in when compared to . Global Services signings
at actual rates were $. billion in as compared to $. billion
in . The Global Services backlog was estimated to be $ bil-
lion at December , , versus $ billion at December , .
The Global Services segments delivered combined pre-tax profit of
$, million, an increase of . percent.
GTS revenue increased . percent ( percent adjusted for cur-
rency) in versus . The strong performance reflected the
extensive transformation which occurred in this business over the past
few years. This transformation included revamping the entire ITS
portfolio, continued improvement in SO delivery and a disciplined
approach to driving new business in existing accounts. Total signings
in GTS increased percent ( percent adjusted for currency). SO
revenue was up . percent ( percent adjusted for currency) with
growth in all geographies, led by EMEA and Asia Pacific. Revenue
growth benefited from prior-year signings, sales of new business in
existing accounts, lower base contract erosion and good yield from
signings. ITS revenue increased . percent ( percent adjusted
for currency). Revenue growth was driven primarily by increased
signings and reflected the strength of the ITS portfolio worldwide.
The revamped ITS portfolio includes ten Service Product Lines
which complement hardware offerings from Systems and Technology
and software offerings from the Software business. The acquisition
of Internet Security Systems (ISS), in the fourth quarter of ,
also contributed to the revenue growth. BTO revenue increased
. percent ( percent adjusted for currency), with double-digit
growth in all geographies. Maintenance revenue increased . per-
cent ( percent adjusted for currency) driven primarily by increased
availability services on non-IBM IT equipment. Services provided to
InfoPrint Solutions, following the divestiture of the printer business
in the second quarter of , contributed points of growth.
GBS revenue increased . percent ( percent adjusted for
currency) with balanced growth across all three geographies. Revenue
performance was led by double-digit growth in application manage-
ment services offerings and growth in all consulting service lines. Total
signings in GBS increased percent ( percent adjusted for currency),
led by growth in shorter term signings.
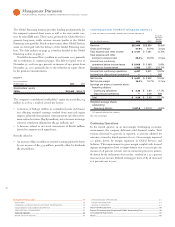
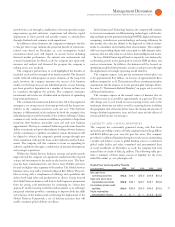
($ )
Yr.-to -Yr.
For the year ended December : 2007 2006 Change
GLOBAL SERVICES GROSS PROFIT:
Global Technology Services:
Gross profit $10,800 $9,623 12.2%
Gross profit margin 29.9% 29.8% 0.1
pts.
Global Business Services:
Gross profit $ 4,240 $3,694 14.8%
Gross profit margin 23.5% 23.1% 0.4
pts.