Vodafone 2015 Annual Report Download - page 50
Download and view the complete annual report
Please find page 50 of the 2015 Vodafone annual report below. You can navigate through the pages in the report by either clicking on the pages listed below, or by using the keyword search tool below to find specific information within the annual report.-
 1
1 -
2
-
3
-
4
-
5
-
6
-
7
-
8
-
9
-
10
-
11
-
12
-
13
-
14
-
15
-
16
-
17
-
18
-
19
-
20
-
21
-
22
-
23
-
24
-
25
-
26
-
27
-
28
-
29
-
30
-
31
-
32
-
33
-
34
-
35
-
36
-
37
-
38
-
39
-
 40
40 -
 41
41 -
 42
42 -
 43
43 -
 44
44 -
 45
45 -
 46
46 -
 47
47 -
 48
48 -
 49
49 -
 50
50 -
 51
51 -
 52
52 -
 53
53 -
 54
54 -
 55
55 -
 56
56 -
 57
57 -
 58
58 -
 59
59 -
 60
60 -
61
-
62
-
63
-
64
-
65
-
66
-
67
-
68
-
69
-
70
-
71
-
72
-
73
-
74
-
75
-
76
-
77
-
78
-
79
-
80
-
81
-
82
-
83
-
84
-
85
-
86
-
87
-
88
-
89
-
90
-
91
-
92
-
93
-
94
-
95
-
96
-
97
-
98
-
99
-
100
-
101
-
102
-
103
-
104
-
105
-
106
-
107
-
108
-
109
-
110
-
111
-
112
-
113
-
114
-
115
-
116
-
117
-
118
-
119
-
120
-
121
-
122
-
123
-
124
-
125
-
126
-
127
-
128
-
129
-
130
-
131
-
132
-
133
-
134
-
135
-
136
-
137
-
138
-
139
-
140
-
141
-
142
-
143
-
144
-
145
-
146
-
147
-
148
-
149
-
150
-
151
-
152
-
153
-
154
-
155
-
156
-
157
-
158
-
159
-
160
-
161
-
162
-
163
-
164
-
165
-
166
-
167
-
168
-
169
-
170
-
171
-
172
-
173
-
174
-
175
-
176
-
177
-
178
-
179
-
180
-
181
-
182
-
183
-
184
-
185
-
186
-
187
-
188
-
189
-
190
-
191
-
192
-
193
-
194
-
195
-
196
-
197
-
198
-
199
-
200
-
201
-
202
-
203
-
204
-
205
-
206
-
207
-
208
-
209
-
210
-
211
-
212
-
213
-
214
-
215
-
216
 |
 |

Vodafone Group Plc
Annual Report 2015
48
Financial position and resources (continued)
Notes:
1 Cash generated by operations, operating free cash ow and free cash ow have been
redened to exclude restructuring costs for the year ended 31 March 2015 of £336 million
(2014: £210 million). Cash generated by operations for the year ended 31 March 2015
also excludes £387 million of other movements including a £365 million UK pensions
contribution payment and £116 million of KDG incentive scheme payments in respect
of liabilities assumed on acquisition. See also note 2 below.
2 Other amounts for the year ended 31 March 2015 include £336 million of restructuring
costs (2014: £210 million), a £365 million UK pensions contribution payment, £359 million
of Verizon Wireless tax distributions received after the completion of the disposal,
£328 million of interest paid on the settlement of the Piramal option, £116 million of KDG
incentive scheme payments in respect of liabilities assumed on acquisition, £176 million
tax refund (2014: £2,372 tax payment) relating to the rationalisation and reorganisation
of our non-US assets prior to the disposal of our stake in Verizon Wireless and a £100 million
(2014: £100 million) payment in respect of the Group’s historical UK tax settlement.
Other amounts for the year ended 31 March 2014 also includes a £1,387 million outow
relating to payment obligations in connection with the purchase of licences and spectrum,
principally in India.
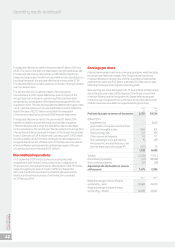
Cash generated by operations
Cash generated by operations excluding restructuring costs decreased
10.0% to £11.1 billion, primarily driven by working capital movements
which more than offset the higher EBITDA.
Capital expenditure
Capital expenditure increased £2.9 billion to £9.2 billion primarily driven
by investments in the Group’s networks as a result of Project Spring.
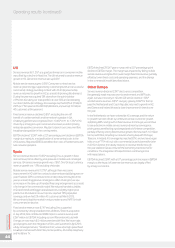
Taxation
Payments for taxation decreased 78.0% to £0.8 billion primarily
as a result of the Group’s disposal of its 45% interest in Verizon Wireless.
Dividends received from associates and investments
Dividends received from associates and investments, decreased
by £2.6 billion to £0.2 billion principally as a result of the disposal of our
interests in Verizon Wireless in the prior year.
Dividends received from associates and investments excludes
£0.4 billion of tax distributions from Verizon Wireless received in the
2015 nancial year after the completion of the disposal (included
in other cash ows) and the £2.1 billion prior year income dividend from
Verizon Wireless .
Free cash ow
Free cash ow decreased to £1.1 billion compared to £4.4 billion in the
prior year as lower payments for taxation were offset by higher cash
capital expenditure and lower dividends received from associates
and investments.
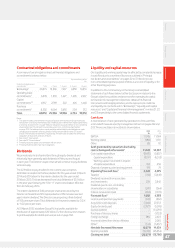
Licence and spectrum payments
Cash payments for licences and spectrum totalled £0.4 billion in respect
of the renewal and acquisition of spectrum in India, Italy, Greece,
Hungary and New Zealand.
Acquisitions and disposals
During the year, we made a £2,945 million payment in relation to the
acquisition of the entire share capital of Ono plus £2,858 million
of associated net debt acquired, a £131 million payment in relation
to the acquisition of the entire share capital of Cobra plus £40 million
of associated debt acquired and a £563 million payment in relation
to the acquisition of the remaining non-controlling interests in Vodafone
India Limited. Further details on the assets and liabilities acquired are
outlined in note 28 ”Acquisitions and disposals”.
In the prior year we disposed of our US Group whose principal asset was
its 45% interest in Verizon Wireless for consideration which included net
cash proceeds of £34.9 billion.
Equity dividends paid
Equity dividends paid during the year decreased by 42% following the
“6for11” share consolidation effective from 24 February 2014.
Special dividend
In the prior year, B share payments formed part of the return of value
to shareholders following the disposal of the Group’s interest
in Verizon Wireless.
Purchase of treasury shares
Prior year cash payments of £1.0 billion relate to the completion
of a £1.5 billion share buyback programme that commenced following
the receipt of a US$3.8 billion (£2.4 billion) income dividend from VZW
in December 2012.
Foreign exchange
A foreign exchange gain of £0.9 billion was recognised on net debt due
to favourable exchange rate movements resulting primarily from the
weakening of the euro and the Indian rupee against pounds sterling.
References to “Q4” are to the quarter ended 31 March 2015 unless otherwise stated.
References to the “second half of the year” are to the six months ended 31 March 2015
unless otherwise stated. References to the “year” or “nancial year” are to the nancial year
ended 31 March 2015 and references to the “prior nancial year” are to the nancial year
ended 31 March 2014 unless otherwise stated. References to the “2015 nancial year”, “2016
nancial year”, “2017 nancial year”, “2018 nancial year” and the “2020 nancial year”
are to the nancial years ending 31 March 2015, 2016, 2017, 2018 and 2020, respectively.
References to “calendar Q3 2015” are to the quarter ended 30 September 2015, unless
otherwise stated.
All amounts marked in this document with an “*” represent organic growth which presents
performance on a comparable basis, both in terms of merger and acquisition activity and
movements in foreign exchange. See page 202 “Non-GAAP information” for further details.
This year’s report contains a strategic report on pages 1 to 48, which
includes an analysis of our performance and position, a review
of the business during the year, and outlines the principal risks and
uncertainties we face. The strategic report was approved by the
Board and signed on its behalf by the Chief Executive and Chief
Financial Ofcer.
Vittorio Colao
Chief Executive Nick Read
Chief Financial Ofcer
19 May 2015