Vodafone 2015 Annual Report Download - page 165
Download and view the complete annual report
Please find page 165 of the 2015 Vodafone annual report below. You can navigate through the pages in the report by either clicking on the pages listed below, or by using the keyword search tool below to find specific information within the annual report.-
 1
1 -
2
-
3
-
4
-
5
-
6
-
7
-
8
-
9
-
10
-
11
-
12
-
13
-
14
-
15
-
16
-
17
-
18
-
19
-
20
-
21
-
22
-
23
-
24
-
25
-
26
-
27
-
28
-
29
-
30
-
31
-
32
-
33
-
34
-
35
-
36
-
37
-
38
-
39
-
40
-
41
-
42
-
43
-
44
-
45
-
46
-
47
-
48
-
49
-
50
-
51
-
52
-
53
-
54
-
55
-
56
-
57
-
58
-
59
-
60
-
61
-
62
-
63
-
64
-
65
-
66
-
67
-
68
-
69
-
70
-
71
-
72
-
73
-
74
-
75
-
76
-
77
-
78
-
79
-
80
-
81
-
82
-
83
-
84
-
85
-
86
-
87
-
88
-
89
-
90
-
91
-
92
-
93
-
94
-
95
-
96
-
97
-
98
-
99
-
100
-
101
-
102
-
103
-
104
-
105
-
106
-
107
-
108
-
109
-
110
-
111
-
112
-
113
-
114
-
115
-
116
-
117
-
118
-
119
-
120
-
121
-
122
-
123
-
124
-
125
-
126
-
127
-
128
-
129
-
130
-
131
-
132
-
133
-
134
-
135
-
136
-
137
-
138
-
139
-
140
-
141
-
142
-
143
-
144
-
145
-
146
-
147
-
148
-
149
-
150
-
151
-
152
-
153
-
154
-
 155
155 -
 156
156 -
 157
157 -
 158
158 -
 159
159 -
 160
160 -
 161
161 -
 162
162 -
 163
163 -
 164
164 -
 165
165 -
 166
166 -
 167
167 -
 168
168 -
 169
169 -
 170
170 -
 171
171 -
 172
172 -
 173
173 -
 174
174 -
 175
175 -
176
-
177
-
178
-
179
-
180
-
181
-
182
-
183
-
184
-
185
-
186
-
187
-
188
-
189
-
190
-
191
-
192
-
193
-
194
-
195
-
196
-
197
-
198
-
199
-
200
-
201
-
202
-
203
-
204
-
205
-
206
-
207
-
208
-
209
-
210
-
211
-
212
-
213
-
214
-
215
-
216
 |
 |
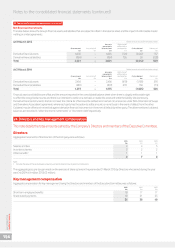
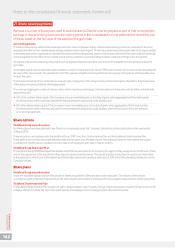
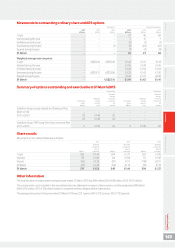
Movements in outstanding ordinary share and ADS options
ADS options Ordinary share options
2015 2014 2013 2015 2014 2013
Millions Millions Millions Millions Millions Millions
1 April – 1 27 40 84
Granted during the year – – – 712 7
Forfeited during the year – – – (2) (1) (1)
Exercised during the year – – (1) (6) (22) (41)
Expired during the year – – – (1) (2) (9)
31 March ––– 25 27 40
Weighted average exercise price:
1 April –US$22.16 US$15.20 £1.42 £1.41 £1.18
Granted during the year – – – £1.56 £1.49 £1.45
Forfeited during the year – – – £1.45 £1.34 £1.64
Exercised during the year –US$29.31 US$13.88 £1.25 £1.43 £1.05
Expired during the year ––– £1.45 £1.37 £0.98
31 March ––US$22.16 £1.49 £1.42 £1.41
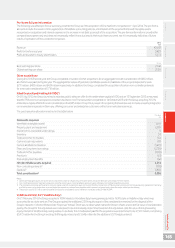
Summary of options outstanding and exercisable at 31 March 2015
Outstanding Exercisable
Weighted Weighted
average average
Weighted remaining Weighted remaining
Outstanding average contractual Exercisable average contractual
shares exercise life shares exercise life
Millions price Months Millions price Months
Vodafone Group savings related and Sharesave Plan:
£0.01–£1.00 ––– –––
£1.01–£2.00 23 £1.48 32 –––
23 £1.48 32 –––
Vodafone Group 1999 Long-Term Stock Incentive Plan:
£1.01–£2.00 2£1.59 22 2£1.59 22
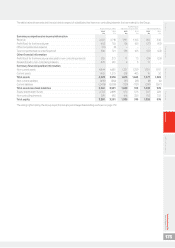
Share awards
Movements in non-vested shares are as follows:
2015 2014 2013
Weighted Weighted Weighted
average fair average fair average fair
value at value at value at
Millions grant date Millions grant date Millions grant date
1 April 243 £1.44 294 £1.27 352 £1.08
Granted 83 £1.63 84 £1.58 91 £1.49
Vested (62) £1.35 (81) £1.11 (118) £0.91
Forfeited (47) £1.35 (54) £1.19 (31) £1.19
31 March 217 £1.56 243 £1.44 294 £1.27
Other information
The total fair value of shares vested during the year ended 31 March 2015 was £84 million (2014: £90 million; 2013: £107 million).
The compensation cost included in the consolidated income statement in respect of share options and share plans was £88 million
(2014:£92 million; 2013: £124 million) which is comprised entirely of equity-settled transactions.
The average share price for the year ended 31 March 2015 was 212.7 pence (2014: 212.2 pence; 2013: 173.0 pence).
Overview Strategy review Performance Governance Financials Additional information Vodafone Group Plc
Annual Report 2015
163