Vodafone 2015 Annual Report Download - page 48
Download and view the complete annual report
Please find page 48 of the 2015 Vodafone annual report below. You can navigate through the pages in the report by either clicking on the pages listed below, or by using the keyword search tool below to find specific information within the annual report.-
 1
1 -
2
-
3
-
4
-
5
-
6
-
7
-
8
-
9
-
10
-
11
-
12
-
13
-
14
-
15
-
16
-
17
-
18
-
19
-
20
-
21
-
22
-
23
-
24
-
25
-
26
-
27
-
28
-
29
-
30
-
31
-
32
-
33
-
34
-
35
-
36
-
37
-
 38
38 -
 39
39 -
 40
40 -
 41
41 -
 42
42 -
 43
43 -
 44
44 -
 45
45 -
 46
46 -
 47
47 -
 48
48 -
 49
49 -
 50
50 -
 51
51 -
 52
52 -
 53
53 -
 54
54 -
 55
55 -
 56
56 -
 57
57 -
 58
58 -
59
-
60
-
61
-
62
-
63
-
64
-
65
-
66
-
67
-
68
-
69
-
70
-
71
-
72
-
73
-
74
-
75
-
76
-
77
-
78
-
79
-
80
-
81
-
82
-
83
-
84
-
85
-
86
-
87
-
88
-
89
-
90
-
91
-
92
-
93
-
94
-
95
-
96
-
97
-
98
-
99
-
100
-
101
-
102
-
103
-
104
-
105
-
106
-
107
-
108
-
109
-
110
-
111
-
112
-
113
-
114
-
115
-
116
-
117
-
118
-
119
-
120
-
121
-
122
-
123
-
124
-
125
-
126
-
127
-
128
-
129
-
130
-
131
-
132
-
133
-
134
-
135
-
136
-
137
-
138
-
139
-
140
-
141
-
142
-
143
-
144
-
145
-
146
-
147
-
148
-
149
-
150
-
151
-
152
-
153
-
154
-
155
-
156
-
157
-
158
-
159
-
160
-
161
-
162
-
163
-
164
-
165
-
166
-
167
-
168
-
169
-
170
-
171
-
172
-
173
-
174
-
175
-
176
-
177
-
178
-
179
-
180
-
181
-
182
-
183
-
184
-
185
-
186
-
187
-
188
-
189
-
190
-
191
-
192
-
193
-
194
-
195
-
196
-
197
-
198
-
199
-
200
-
201
-
202
-
203
-
204
-
205
-
206
-
207
-
208
-
209
-
210
-
211
-
212
-
213
-
214
-
215
-
216
 |
 |

Vodafone Group Plc
Annual Report 2015
46
Financial position and resources
Operating results (continued)
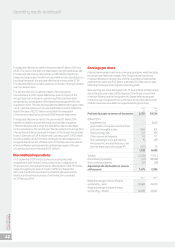
Consolidated statement of nancial position
The consolidated statement of nancial position is set out on page
106. Details on the major movements of both our assets and liabilities
in the year are set out below:
Assets
Goodwill and other intangible assets
Our total intangible assets decreased to £43.5 billion from £46.7 billion.
The increase primarily arose as a result of £2.6 billion additions
as a result of the Group’s acquisitions, primarily Ono, and other
additions of £2.3 billion, including £0.5 billion of spectrum acquired
in India, Italy, Greece, Hungary and New Zealand. This was offset
by a reduction of £3.6 billion as a result of unfavourable movements
in foreign exchange rates and £4.5 billion of amortisation.
Property, plant and equipment
Property, plant and equipment increased to £26.6 billion from
£22.9 billion, principally as a result of £7.4 billion of additions and
£3.4 billion arising from Group acquisitions. This was partially offset
by £5.0 billion of depreciation charges and £1.9 billion of adverse
foreign exchange movements.
Other non-current assets
Other non-current assets increased by £5.1 billion to £32.6 billion,
mainly due to a £3.2 billion increase in recognised deferred tax
assets, primarily in respect of tax losses in Luxembourg (see note
6 for details) and a £1.5 billion increase in the value of derivative
nancial instruments.
Total equity and liabilities
Total equity
Total equity decreased by £4.0 billion to £67.7 billion mainly due
to the total comprehensive expense for the year of £0.8 billion and
dividends paid to equity shareholders and non-controlling interests
of £3.2 billion.
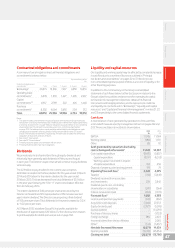
Borrowings
Total borrowings increased to £35.1 billion from £29.2 billion,
primarily as the result of an increase in the level of commercial paper
to £5.1 billion (2014: £1.0 billion). A net debt reconciliation is provided
on page 47.
Other current liabilities
Other current liabilities decreased to £16.3 billion (2014: £17.3 billion).
Trade payables at 31 March 2015 were equivalent to 35 days
(2014: 40days) outstanding, calculated by reference to the amount
owed to suppliers as a proportion of the amounts invoiced by suppliers
during the year. It is our policy to agree terms of transactions, including
payment terms, with suppliers and it is our normal practice that
payment is made accordingly.
Other AMAP
Service revenue increased 5.5%*, with growth in Turkey, Egypt, Qatar
and Ghana partially offset by a decline in New Zealand.
Service revenue in Turkey was up 9.4%*, reecting continued strong
growth in consumer contract and enterprise revenue, including
higher ARPU and data usage, partly offset by a 1.8 percentage point
negative impact from voice and SMS MTR cuts. In Egypt, service
revenue grew 2.8%* as a result of an increase in data and voice usage
and a more stable economic environment. In New Zealand, service
revenue was down 2.6%* as a result of aggressive competition,
but the contract mobile base grew 4.6% year-on-year and the xed
base beneted from continued uptake of VDSL, TV and unlimited
broadband. Service revenue in Ghana grew 18.9%* driven by growth
in customers, voice bundles and data. Total revenue growth
in Qatar was 16.0%*, but slowed in H2 due to signicantly increased
price competition.
EBITDA grew 6.6%* with a 0.4* percentage point decline
in EBITDA margin.
Associates
Vodafone Hutchison Australia (‘VHA’), in which Vodafone owns
a 50% stake, continued its good recovery, returning to local currency
service revenue growth in Q4 as a result of improving trends
in both customer numbers and ARPU, supported by signicant
network enhancements.
Safaricom, Vodafone’s 40% associate which is the number one
mobile operator in Kenya, saw local currency service revenue
growth of 12.9% for the year, with local currency EBITDA up 16.8%.
The total value of deposits, customer transfers, withdrawals and
other payments handled through the M-Pesa system grew 26%
to KES 4,181 billion in the 2015 nancial year.
Indus Towers, the Indian towers company in which Vodafone has
a 42% interest, achieved local currency revenue growth of 4.3%.
Indus owns 116,000 towers, with a tenancy ratio of 2.19x. Our shares
of Indus Towers’ EBITDA and adjusted operating prot were
£285 million and £19 million respectively.