Vodafone 2015 Annual Report Download - page 11
Download and view the complete annual report
Please find page 11 of the 2015 Vodafone annual report below. You can navigate through the pages in the report by either clicking on the pages listed below, or by using the keyword search tool below to find specific information within the annual report.-
 1
1 -
 2
2 -
 3
3 -
 4
4 -
 5
5 -
 6
6 -
 7
7 -
 8
8 -
 9
9 -
 10
10 -
 11
11 -
 12
12 -
 13
13 -
 14
14 -
 15
15 -
 16
16 -
 17
17 -
 18
18 -
 19
19 -
 20
20 -
 21
21 -
 22
22 -
23
-
24
-
25
-
26
-
27
-
28
-
29
-
30
-
31
-
32
-
33
-
34
-
35
-
36
-
37
-
38
-
39
-
40
-
41
-
42
-
43
-
44
-
45
-
46
-
47
-
48
-
49
-
50
-
51
-
52
-
53
-
54
-
55
-
56
-
57
-
58
-
59
-
60
-
61
-
62
-
63
-
64
-
65
-
66
-
67
-
68
-
69
-
70
-
71
-
72
-
73
-
74
-
75
-
76
-
77
-
78
-
79
-
80
-
81
-
82
-
83
-
84
-
85
-
86
-
87
-
88
-
89
-
90
-
91
-
92
-
93
-
94
-
95
-
96
-
97
-
98
-
99
-
100
-
101
-
102
-
103
-
104
-
105
-
106
-
107
-
108
-
109
-
110
-
111
-
112
-
113
-
114
-
115
-
116
-
117
-
118
-
119
-
120
-
121
-
122
-
123
-
124
-
125
-
126
-
127
-
128
-
129
-
130
-
131
-
132
-
133
-
134
-
135
-
136
-
137
-
138
-
139
-
140
-
141
-
142
-
143
-
144
-
145
-
146
-
147
-
148
-
149
-
150
-
151
-
152
-
153
-
154
-
155
-
156
-
157
-
158
-
159
-
160
-
161
-
162
-
163
-
164
-
165
-
166
-
167
-
168
-
169
-
170
-
171
-
172
-
173
-
174
-
175
-
176
-
177
-
178
-
179
-
180
-
181
-
182
-
183
-
184
-
185
-
186
-
187
-
188
-
189
-
190
-
191
-
192
-
193
-
194
-
195
-
196
-
197
-
198
-
199
-
200
-
201
-
202
-
203
-
204
-
205
-
206
-
207
-
208
-
209
-
210
-
211
-
212
-
213
-
214
-
215
-
216
 |
 |

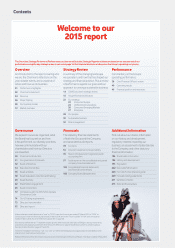
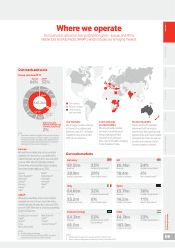
Where we operate
Our business is split across two geographic regions – Europe, and Africa,
Middle East and Asia Pacic (‘AMAP’), which includes our emerging markets.
Europe
We are the number one or two mobile
operator in most of our countries with
market shares ranging from around 20%
to over 40%. We are typically smaller
in xed line, with market shares ranging
from low single-digit up to 20%.
Albania
Czech Republic#
Germany#
Greece#
Hungary
Ireland#
Italy#
Malta#
Netherlands#
Portugal#
Romania#
Spain#
UK#
AMAP
We are the number one or two mobile
operator in most of our countries with
market shares ranging from around 20%
to over 50%. We have a small but growing
share in xed line.
Australia (joint venture)
Egypt#
Ghana#
India
Kenya (associate)
New Zealand#
Qatar#
Turkey#
Vodacom Group#2
Our main markets
Our markets
We provide mobile services
in these 24countries and
xed services in 17 of these.
Together they account for
98% of our revenue.
Joint ventures
and associates
We also provide mobile
services in Australia and
Kenya, taking our total
markets to 26. We also
part-own the tower company
Indus Towers in India.
Partner markets
These are the 55 markets
where we hold no equity
interest but have partnership
agreements with local mobile
operators for them to use our
products and services and
in some cases our brand.
Our markets
Partner markets
Joint ventures
and associates
UK
£6.4bn
revenue
18.4m
mobile customers
24%
mobile market share3
4%
xed market share3
Germany
£8.5bn
revenue
30.9m
mobile customers
33%
mobile market share3
20%
xed market share3
Spain
£3.7bn
revenue
14.2m
mobile customers
30%
mobile market share3
11%
xed market share3
Italy
£4.6bn
revenue
25.2m
mobile customers
32%
mobile market share3
6%
xed market share3
Vodacom Group
£4.3bn
revenue
68.5m
mobile customers
53%
mobile market share3
(South Africa)
India
£4.3bn
revenue
183.8m
mobile customers
23%
mobile market share4
Group revenue 2015
Note:
1 Common functions includes revenue from services
provided centrally or offered outside our operating
company footprint, including some markets where
we have a licensed network operation, for example
offering IP-VPN services in Singapore.
Notes:
3 Vodafone estimates for the quarter ended 31 March 2015.
4 Source: Telecom Regulatory Authority of India, December 2014.
Germany Vodacom
UK
Italy
Spain
Other
Europe
India
Europe
AMAP
Other
AMAP
Europe
66% AMAP
32%
Other (includes
partner markets and
common functions)1
2%
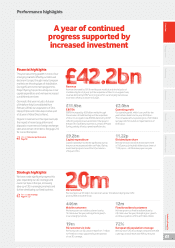
£42.2bn
Our reach and scale
Notes:
# Fixed broadband markets.
2 Democratic Republic of Congo (‘DRC’), Lesotho,
Mozambique, South Africa and Tanzania.
Overview Strategy review Performance Governance Financials Additional information Vodafone Group Plc
Annual Report 2015
09