Vodafone 2015 Annual Report Download - page 157
Download and view the complete annual report
Please find page 157 of the 2015 Vodafone annual report below. You can navigate through the pages in the report by either clicking on the pages listed below, or by using the keyword search tool below to find specific information within the annual report.-
 1
1 -
2
-
3
-
4
-
5
-
6
-
7
-
8
-
9
-
10
-
11
-
12
-
13
-
14
-
15
-
16
-
17
-
18
-
19
-
20
-
21
-
22
-
23
-
24
-
25
-
26
-
27
-
28
-
29
-
30
-
31
-
32
-
33
-
34
-
35
-
36
-
37
-
38
-
39
-
40
-
41
-
42
-
43
-
44
-
45
-
46
-
47
-
48
-
49
-
50
-
51
-
52
-
53
-
54
-
55
-
56
-
57
-
58
-
59
-
60
-
61
-
62
-
63
-
64
-
65
-
66
-
67
-
68
-
69
-
70
-
71
-
72
-
73
-
74
-
75
-
76
-
77
-
78
-
79
-
80
-
81
-
82
-
83
-
84
-
85
-
86
-
87
-
88
-
89
-
90
-
91
-
92
-
93
-
94
-
95
-
96
-
97
-
98
-
99
-
100
-
101
-
102
-
103
-
104
-
105
-
106
-
107
-
108
-
109
-
110
-
111
-
112
-
113
-
114
-
115
-
116
-
117
-
118
-
119
-
120
-
121
-
122
-
123
-
124
-
125
-
126
-
127
-
128
-
129
-
130
-
131
-
132
-
133
-
134
-
135
-
136
-
137
-
138
-
139
-
140
-
141
-
142
-
143
-
144
-
145
-
146
-
 147
147 -
 148
148 -
 149
149 -
 150
150 -
 151
151 -
 152
152 -
 153
153 -
 154
154 -
 155
155 -
 156
156 -
 157
157 -
 158
158 -
 159
159 -
 160
160 -
 161
161 -
 162
162 -
 163
163 -
 164
164 -
 165
165 -
 166
166 -
 167
167 -
168
-
169
-
170
-
171
-
172
-
173
-
174
-
175
-
176
-
177
-
178
-
179
-
180
-
181
-
182
-
183
-
184
-
185
-
186
-
187
-
188
-
189
-
190
-
191
-
192
-
193
-
194
-
195
-
196
-
197
-
198
-
199
-
200
-
201
-
202
-
203
-
204
-
205
-
206
-
207
-
208
-
209
-
210
-
211
-
212
-
213
-
214
-
215
-
216
 |
 |
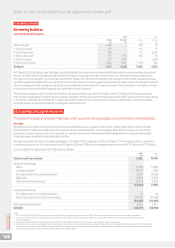
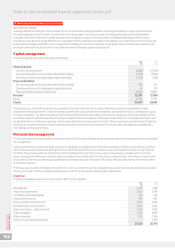
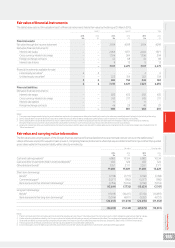
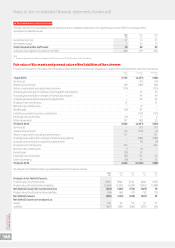
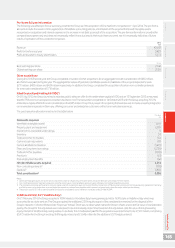
Fair value of nancial instruments
The table below sets out the valuation basis1 of nancial instruments held at fair value by the Group at 31 March 2015.
Level 12 Level 23 Total
2015 2014 2015 2014 2015 2014
£m £m £m £m £m £m
Financial assets:
Fair value through the income statement – – 3,18 4 4,019 3 ,18 4 4,019
Derivative nancial instruments:
Interest rate swaps – – 2,466 1,871 2,466 1,871
Cross currency interest rate swaps – – 1,506 504 1,506 504
Foreign exchange contracts – – 33 68 33 68
Interest rate futures – – 8 13 8 13
– – 7,197 6,475 7,197 6,475
Financial investments available-for-sale:
Listed equity securities44 6 – – 4 6
Unlisted equity securities4– – 222 154 222 154
4 6 222 154 226 160
4 6 7,419 6,629 7,423 6,635
Financial liabilities:
Derivative nancial instruments:
Interest rate swaps – – 682 635 682 635
Cross currency interest rate swaps – – 245 217 245 217
Interest rate options – – 11 –11 –
Foreign exchange contracts – – 46 29 46 29
– – 984 881 984 881
Notes:
1 There were no changes made during the year to valuation methods or the processes to determine classication and no transfers were made between the levels in the fair value hierarchy.
2 Level 1 classication comprises nancial instruments where fair value is determined by unadjusted quoted prices in active markets for identical assets or liabilities.
3 Level 2 classication comprises items where fair value is determined from inputs other than quoted prices that are observable for the asset or liability, either directly or indirectly.
Derivative nancial instrument fair values are present values determined from future cash ows discounted at rates derived from market sourced data.
4 Listed and unlisted securities are classied as held for sale nancial assets and fair values are derived from observable quoted market prices for similar items. Details are included in note 13
“Other investments”.
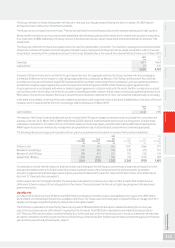
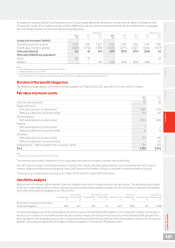
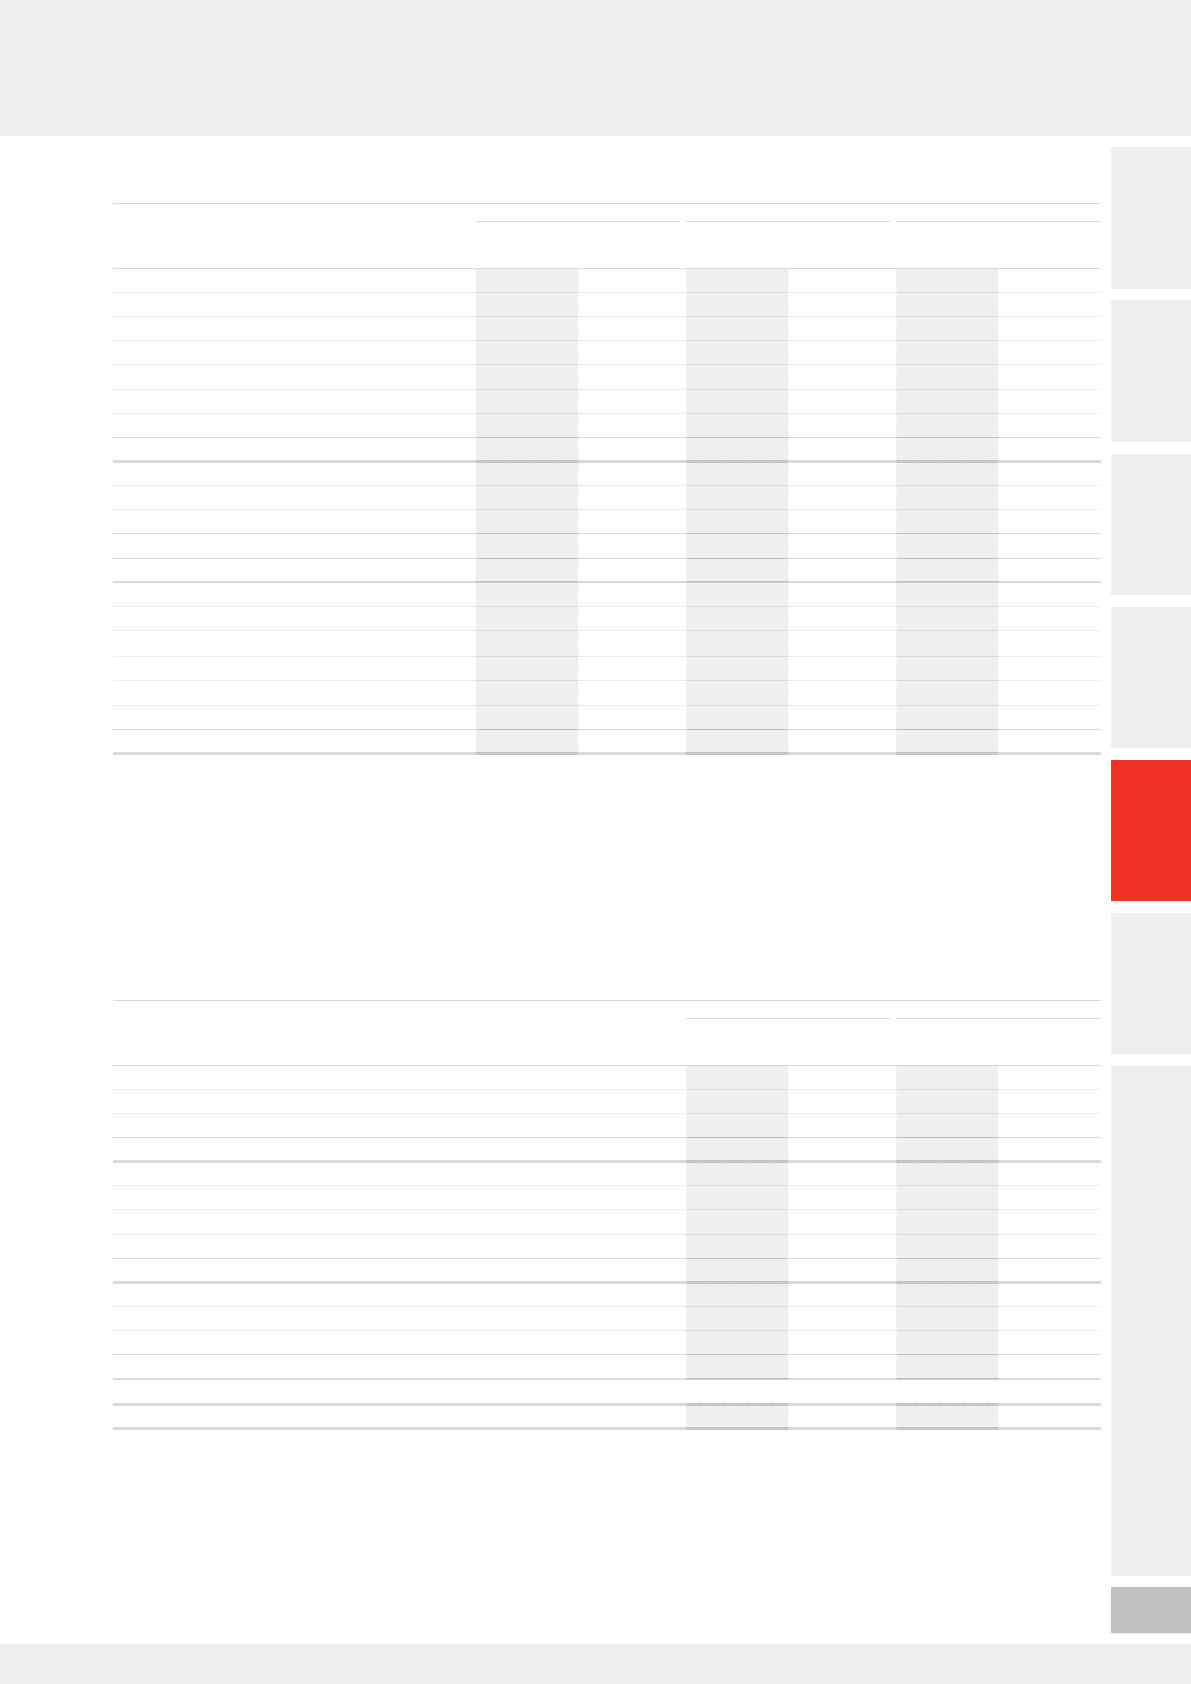
Fair value and carrying value information
The fair values and carrying values of the Group’s nancial assets and nancial liabilities held at amortised cost are set out in the table below1.
Unless otherwise stated, the valuation basis is level 2, comprising nancial instruments where fair value is determined from inputs other than quoted
prices observable for the asset or liability either directly or indirectly.
Fair value Carrying value
2015 2014 2015 2014
£m £m £m £m
Cash and cash equivalents26,882 10,134 6,882 10,134
Cash and other investments held in restricted deposits2650 524 650 524
Other debt and bonds33, 551 3,171 3, 551 3,171
11,083 13,829 11,083 13,829
Short-term borrowings:
Bonds4(1,798) (1,771) (1,786) (1,783)
Commercial paper5(5,077) (950) (5,077) (950)
Bank loans and other short-term borrowings5(5,766) (5,014) (5,760) (5,014)
(12,641) (7,735) (12,623) (7,747)
Long-term borrowings:
Bonds4(17,109) (16,417) (17,174) (16,697)
Bank loans and other long-term borrowings5(5,346) (4,817) (5,261) (4,757)
(22,455) (21,234) (22,435) (21,454)
(24,013) (15,140) (23,975) (15,372)
Notes:
1 The Group’s trade and other receivables and trade and other payables are not shown in the table above. The carrying amounts of both categories approximate their fair values.
2 Cash and cash equivalents are held by the Group on a short term basis with all having a maturity of three months or less. The carrying value approximates their fair value.
3 Other debt and bonds is predominantly comprised of loan notes from Verizon Communications held at amortised cost. Details included in note 13 “Other investments”.
4 The Group’s bonds are held at amortised cost with fair values available from market observable prices.
5 Commercial paper and other banks loans are held at amortised cost with fair values calculated from market observable data where appropriate.
Overview Strategy review Performance Governance Financials Additional information Vodafone Group Plc
Annual Report 2015
155