Vodafone 2015 Annual Report Download - page 15
Download and view the complete annual report
Please find page 15 of the 2015 Vodafone annual report below. You can navigate through the pages in the report by either clicking on the pages listed below, or by using the keyword search tool below to find specific information within the annual report.-
 1
1 -
2
-
3
-
4
-
 5
5 -
 6
6 -
 7
7 -
 8
8 -
 9
9 -
 10
10 -
 11
11 -
 12
12 -
 13
13 -
 14
14 -
 15
15 -
 16
16 -
 17
17 -
 18
18 -
 19
19 -
 20
20 -
 21
21 -
 22
22 -
 23
23 -
 24
24 -
 25
25 -
26
-
27
-
28
-
29
-
30
-
31
-
32
-
33
-
34
-
35
-
36
-
37
-
38
-
39
-
40
-
41
-
42
-
43
-
44
-
45
-
46
-
47
-
48
-
49
-
50
-
51
-
52
-
53
-
54
-
55
-
56
-
57
-
58
-
59
-
60
-
61
-
62
-
63
-
64
-
65
-
66
-
67
-
68
-
69
-
70
-
71
-
72
-
73
-
74
-
75
-
76
-
77
-
78
-
79
-
80
-
81
-
82
-
83
-
84
-
85
-
86
-
87
-
88
-
89
-
90
-
91
-
92
-
93
-
94
-
95
-
96
-
97
-
98
-
99
-
100
-
101
-
102
-
103
-
104
-
105
-
106
-
107
-
108
-
109
-
110
-
111
-
112
-
113
-
114
-
115
-
116
-
117
-
118
-
119
-
120
-
121
-
122
-
123
-
124
-
125
-
126
-
127
-
128
-
129
-
130
-
131
-
132
-
133
-
134
-
135
-
136
-
137
-
138
-
139
-
140
-
141
-
142
-
143
-
144
-
145
-
146
-
147
-
148
-
149
-
150
-
151
-
152
-
153
-
154
-
155
-
156
-
157
-
158
-
159
-
160
-
161
-
162
-
163
-
164
-
165
-
166
-
167
-
168
-
169
-
170
-
171
-
172
-
173
-
174
-
175
-
176
-
177
-
178
-
179
-
180
-
181
-
182
-
183
-
184
-
185
-
186
-
187
-
188
-
189
-
190
-
191
-
192
-
193
-
194
-
195
-
196
-
197
-
198
-
199
-
200
-
201
-
202
-
203
-
204
-
205
-
206
-
207
-
208
-
209
-
210
-
211
-
212
-
213
-
214
-
215
-
216
 |
 |

Where the industry
is heading
The pace of change in the industry is expected to remain signicant –
the demand for data is accelerating, there is an ongoing shift towards
xed and mobile bundles, networks are improving, and the market
environment is becoming more positive.
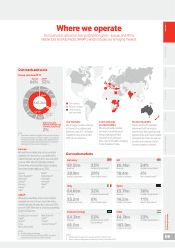
Growing importance of
data, emerging markets and
other new revenue areas
Traditional revenue sources – mobile voice
and texts – have reached maturity in a number
of markets. Therefore, to deliver future growth
opportunities, we are investing in newer
revenue areas such as data. It is estimated
that between 2014 and 2018 mobile data
revenue will grow by 18%, compared to a 7%
decline in voice revenue over the same
period. The demand for data will continue
to be driven by rising smartphone and tablet
penetration and usage, and improvements
in mobile network capability. Already 95%
of the world’s total trafc on mobile networks
is data. The data services most used are video
streaming and internet browsing which require
high speed networks. Therefore, operators
are investing more in 4G in European markets
and a combination of 4G and 3G in emerging
markets to provide much faster data speeds.
Emerging markets have signicant potential
for customer and revenue growth driven
by rising populations, strong economic
growth, lower mobile penetration and a lack
of alternative xed line infrastructure. By 2018
it is expected that there will be 1.5 billion new
mobile users in emerging markets, taking their
share of global users to 79%.
Other new revenue streams are being pursued
which extend the use of mobile beyond
everyday communication. These include
money transfers and payments using
a handset, and M2M services such as smart
metering and the location monitoring
of vehicles, through a SIM card embedded
in the vehicle.
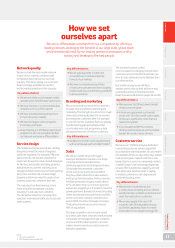
Convergence of xed
and mobile into unied
communications
We expect a continued trend towards unied
communications or bundled mobile, xed and
TV services so that customers can use data
services wherever they are and on whatever
device they want.
Internet-based providers often offer “free
calls and texts” services, so mobile operators
increasingly sell unlimited voice and text
bundles, and combine this with a xed fee
for data usage. While we expect the level
of competition to remain robust, we have seen
some encouraging signs of consolidation
among European telecoms operators which
is supportive of further investment.
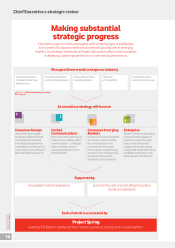
Improving business
environment in Europe
As Europe represents the majority of our
revenue, the environment is important to us.
The economic recession in Europe over the
last few years has been a key driver of the
declining revenue trends in the region for
many operators. However, the return to GDP
growth in 2014 bodes well for the future.
The regulatory environment in Europe
remains challenging, as a result of ongoing
cuts to regulated revenues such as roaming
and MTRs. The European Commission has
recently announced a new Digital Single
Market package of legislative measures.
While this emphasises the need to improve
the investment climate, it still needs
to translate into specic legislative measures
which – if rapidly adopted – would have
a positive impact.
Notes:
1 ITU Telecommunication Development Bureau.
2 Merrill Lynch.
3 Strategy analytics.
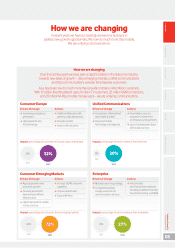
Share of industry %
mobile service revenue3
58 56 54 53
2014 2015 2016 2017 2018
52
42 44 46 47 48
0
80
60
40
20
100
Data/Text Voice
Share of industry mobile users3 %
76 77 78 78
2014 2015 2016 2017 2018
79
24 23 22 22 21
0
80
60
40
20
100
Mature markets Emerging markets
The demand for bundled services has
been a feature of the enterprise market for
several years and is becoming more visible
in the consumer market. We believe that
this demand, combined with technological
advances delivering easier connection
of multiple data devices, will support strong
data growth in the future. Therefore this will
need to be managed by access to next-
generation xed networks, principally cable
or bre, to support increased speed and meet
capacity requirements.
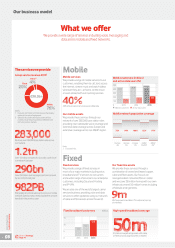
Continued network innovation
The pace of innovation and development
in the networks is increasing. For example,
4G, which we only launched in 2010 already
accounts for 30% of data trafc on Vodafone’s
European networks. Standard 4G provides
speeds of up to 150 Mbps, which is more than
three times the highest 3G speeds. The next
stage of 4G development is 4G+, which bonds
together multiple spectrum blocks to provide
typical peak speeds of up to 450 Mbps.
High-Denition voice is another new mobile
technology which provides customers with
crystal clear call quality. In the xed broadband
sector operators are investing more in
bre which provides data speeds typically
up to 300 Mbps to 1 Gbps, compared with
up to 24 Mbps on copper broadband.
Continued high level
of competition
The high level of competitive intensity
in the communications industry is expected
to continue between established MNOs,
MVNOs, xed operators and internet- based
services providers. MVNOs and smaller mobile
operators are often attractive to value seekers.
However, the high level of investment in 4G
and unied communications by larger MNOs,
such as Vodafone, enables differentiation
through higher network and service quality.
Fixed operators often bundle their services
with mobile, leading Vodafone to acquire xed
capability to bundle with mobile, through
investment in bre networks, acquisitions and
wholesale agreements.
Overview Strategy review Performance Governance Financials Additional information Vodafone Group Plc
Annual Report 2015
13