Vodafone 2015 Annual Report Download - page 147
Download and view the complete annual report
Please find page 147 of the 2015 Vodafone annual report below. You can navigate through the pages in the report by either clicking on the pages listed below, or by using the keyword search tool below to find specific information within the annual report.-
 1
1 -
2
-
3
-
4
-
5
-
6
-
7
-
8
-
9
-
10
-
11
-
12
-
13
-
14
-
15
-
16
-
17
-
18
-
19
-
20
-
21
-
22
-
23
-
24
-
25
-
26
-
27
-
28
-
29
-
30
-
31
-
32
-
33
-
34
-
35
-
36
-
37
-
38
-
39
-
40
-
41
-
42
-
43
-
44
-
45
-
46
-
47
-
48
-
49
-
50
-
51
-
52
-
53
-
54
-
55
-
56
-
57
-
58
-
59
-
60
-
61
-
62
-
63
-
64
-
65
-
66
-
67
-
68
-
69
-
70
-
71
-
72
-
73
-
74
-
75
-
76
-
77
-
78
-
79
-
80
-
81
-
82
-
83
-
84
-
85
-
86
-
87
-
88
-
89
-
90
-
91
-
92
-
93
-
94
-
95
-
96
-
97
-
98
-
99
-
100
-
101
-
102
-
103
-
104
-
105
-
106
-
107
-
108
-
109
-
110
-
111
-
112
-
113
-
114
-
115
-
116
-
117
-
118
-
119
-
120
-
121
-
122
-
123
-
124
-
125
-
126
-
127
-
128
-
129
-
130
-
131
-
132
-
133
-
134
-
135
-
136
-
 137
137 -
 138
138 -
 139
139 -
 140
140 -
 141
141 -
 142
142 -
 143
143 -
 144
144 -
 145
145 -
 146
146 -
 147
147 -
 148
148 -
 149
149 -
 150
150 -
 151
151 -
 152
152 -
 153
153 -
 154
154 -
 155
155 -
 156
156 -
 157
157 -
158
-
159
-
160
-
161
-
162
-
163
-
164
-
165
-
166
-
167
-
168
-
169
-
170
-
171
-
172
-
173
-
174
-
175
-
176
-
177
-
178
-
179
-
180
-
181
-
182
-
183
-
184
-
185
-
186
-
187
-
188
-
189
-
190
-
191
-
192
-
193
-
194
-
195
-
196
-
197
-
198
-
199
-
200
-
201
-
202
-
203
-
204
-
205
-
206
-
207
-
208
-
209
-
210
-
211
-
212
-
213
-
214
-
215
-
216
 |
 |

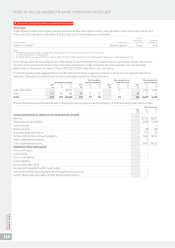
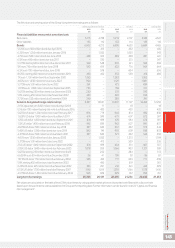
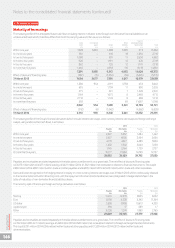
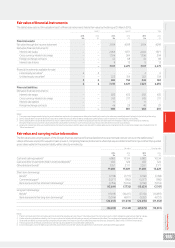
The fair value and carrying value of the Group’s long-term borrowings are as follows:
Sterling equivalent nominal value Fair value Carrying value
2015 2014 2015 2014 2015 2014
£m £m £m £m £m £m
Financial liabilities measured at amortised cost:
Bank loans 5,173 4,788 5,213 4,707 5 ,128 4,647
Other liabilities 133 110 133 110 133 110
Bonds: 6,002 4,272 6,908 4,620 6,684 4,465
5.125% euro 500 million bond due April 2015 – 413 – 432 – 435
6.25% euro 1,250 million bond due January 2016 – 1,032 – 1,020 – 943
4.75% euro 500 million bond due June 2016 268 302 283 328 287 441
6.5% euro 400 million bond due July 2017 – 330 – 351 – 347
5.375% sterling 600 million bond due December 2017 549 548 605 611 568 569
5% euro 750 million bond due June 2018 542 619 622 716 564 644
6.5% euro 700 million bond due June 2018 – 578 – 604 – 606
8.125% sterling 450 million bond due November 2018 450 450 553 558 476 480
1% euro 1,750 million bond due September 2020 1,265 – 1,283 – 1,263 –
4.65% euro 1,250 million bond January 2022 904 – 1,12 9 – 1,081 –
5.375% euro 500 million bond June 2022 361 – 475 – 484 –
1.875% euro 1,000 million bond due September 2025 723 – 76 8 – 721 –
5.625% sterling 250 million bond due December 2025 250 – 313 – 343 –
5.9% sterling 450 million bond due November 2032 450 – 592 – 656 –
2.75% euro 332 million bond due December 2034 240 – 285 – 241 –
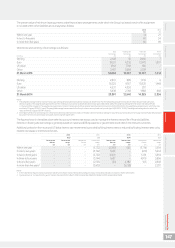
Bonds in designated hedge relationships: 9,397 10,951 10,201 11,797 10,490 12,232
2.15% Japanese yen 3,000 million bond due April 2015 – 17 – 18 – 18
US dollar 700 million oating rate note due February 2016 – 420 – 420 – 420
5.625% US dollar 1,300 million bond due February 2017 876 779 946 8 74 920 836
1.625% US dollar 1,000 million bond due March 2017 6 74 599 679 607 672 597
1.25% US dollar 1,000 million bond due September 2017 6 74 599 670 594 672 597
1.5% US dollar 1,400 million bond due February 2018 943 839 942 827 941 837
4.625% US dollar 500 million bond due July 2018 337 300 367 332 375 343
5.45% US dollar 1,250 million bond due June 2019 842 749 955 859 938 833
4.375% US dollar 500 million bond due March 2021 337 300 371 322 346 296
4.65% euro 1,250 million bond due January 2022 – 1,032 – 1,213 – 1,19 4
5.375% euro 500 million bond due June 2022 – 413 – 509 – 536
2.5% US dollar 1,000 million bond due September 2022 674 599 654 551 667 557
2.95% US dollar 1,600 million bond due February 2023 1,078 959 1,066 903 1,121 939
5.625% sterling 250 million bond due December 2025 – 250 – 284 – 313
6.6324% euro 50 million bond due December 2028 36 41 109 93 86 81
7.875% US dollar 750 million bond due February 2030 505 450 711 603 771 698
5.9% sterling 450 million bond due November 2032 – 450 – 519 – 561
6.25% US dollar 495 million bond due November 2032 333 297 410 341 445 399
6.15% US dollar 1,700 million bond due February 2037 1,145 1,019 1,392 1,166 1,578 1,416
4.375% US dollar 1,400 million bond due February 2043 943 839 929 762 958 761
Long-term borrowings 20,705 20,121 22,455 21,234 22,435 21,454
Fair values are calculated on the basis of level 2 fair value hierarchy using quoted market prices or discounted cash ows with a discount rate
based upon forward interest rates available to the Group at the reporting date. Further information can be found in note 23 “Capital and nancial
risk management”.
Overview Strategy review Performance Governance Financials Additional information Vodafone Group Plc
Annual Report 2015
145