Vodafone 2015 Annual Report Download - page 185
Download and view the complete annual report
Please find page 185 of the 2015 Vodafone annual report below. You can navigate through the pages in the report by either clicking on the pages listed below, or by using the keyword search tool below to find specific information within the annual report.-
 1
1 -
2
-
3
-
4
-
5
-
6
-
7
-
8
-
9
-
10
-
11
-
12
-
13
-
14
-
15
-
16
-
17
-
18
-
19
-
20
-
21
-
22
-
23
-
24
-
25
-
26
-
27
-
28
-
29
-
30
-
31
-
32
-
33
-
34
-
35
-
36
-
37
-
38
-
39
-
40
-
41
-
42
-
43
-
44
-
45
-
46
-
47
-
48
-
49
-
50
-
51
-
52
-
53
-
54
-
55
-
56
-
57
-
58
-
59
-
60
-
61
-
62
-
63
-
64
-
65
-
66
-
67
-
68
-
69
-
70
-
71
-
72
-
73
-
74
-
75
-
76
-
77
-
78
-
79
-
80
-
81
-
82
-
83
-
84
-
85
-
86
-
87
-
88
-
89
-
90
-
91
-
92
-
93
-
94
-
95
-
96
-
97
-
98
-
99
-
100
-
101
-
102
-
103
-
104
-
105
-
106
-
107
-
108
-
109
-
110
-
111
-
112
-
113
-
114
-
115
-
116
-
117
-
118
-
119
-
120
-
121
-
122
-
123
-
124
-
125
-
126
-
127
-
128
-
129
-
130
-
131
-
132
-
133
-
134
-
135
-
136
-
137
-
138
-
139
-
140
-
141
-
142
-
143
-
144
-
145
-
146
-
147
-
148
-
149
-
150
-
151
-
152
-
153
-
154
-
155
-
156
-
157
-
158
-
159
-
160
-
161
-
162
-
163
-
164
-
165
-
166
-
167
-
168
-
169
-
170
-
171
-
172
-
173
-
174
-
 175
175 -
 176
176 -
 177
177 -
 178
178 -
 179
179 -
 180
180 -
 181
181 -
 182
182 -
 183
183 -
 184
184 -
 185
185 -
 186
186 -
 187
187 -
 188
188 -
 189
189 -
 190
190 -
 191
191 -
 192
192 -
 193
193 -
 194
194 -
 195
195 -
196
-
197
-
198
-
199
-
200
-
201
-
202
-
203
-
204
-
205
-
206
-
207
-
208
-
209
-
210
-
211
-
212
-
213
-
214
-
215
-
216
 |
 |
4. Other investments
Accounting policies
Gains and losses arising from changes in fair values of available-for-sale investments are recognised directly in equity, until the investment
is disposed of or is determined to be impaired, at which time the cumulative gain or loss previously recognised in equity, determined using the
weighted average cost method, is included in the net prot or loss for the period.
2015 2014
£m £m
Investments137 130
Note:
1 Investments includes collateral paid on derivative nancial instruments of £37 million (2014: £130 million).
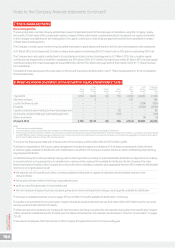
5. Creditors
Accounting policies
Capital market and bank borrowings
Interest bearing loans and overdrafts are initially measured at fair value (which is equal to cost at inception) and are subsequently measured
at amortised cost using the effective interest rate method, except where they are identied as a hedged item in a fair value hedge. Any difference
between the proceeds net of transaction costs and the settlement or redemption of borrowings is recognised over the term of theborrowing.
2015 2014
£m £m
Amounts falling due within one year:
Bank loans and other loans 9,895 4,120
Amounts owed to subsidiaries 152,904 169,845
Other creditors 340 161
Accruals and deferred income 25 17
163,164 174,143
Amounts falling due after more than one year:
Deferred tax 4 –
Other loans 18,736 17,504
Other creditors 664 751
19,404 18,255
Included in amounts falling due after more than one year are other loans of £11,533 million, which are due in more than ve years from 1 April 2015
and are payable otherwise than by instalments. Interest payable on these loans ranges from 0.635% to 7.875%.
6. Share capital
Accounting policies
Equity instruments issued by the Company are recorded at the proceeds received, net of direct issuance costs.
2015 2014
Number £m Number £m
Ordinary shares of 2020/21 US cents each allotted,
issued and fully paid:1,2
1 April 28,811,923,128 3,792 53,820,386,309 3,866
Allotted during the year 863,970 – 1,423,737 –
Consolidated during the year3– – (24,009,886,918) –
Cancelled during the year – – (1,000,000,000) (74)
31 March 28,812,787,098 3,792 28,811,923,128 3,792
Notes:
1 50,000 (2014: 50,000) 7% cumulative xed rate shares of £1 each were allotted, issued and fully paid by the Company.
2 At 31 March 2015, the Company held 2,300,749,013 (2014: 2,371,962,907) treasury shares with a nominal value of £303 million (2014: £312 million).
3 On 19 February 2014, we announced a “6 for 11” share consolidation effective 24 February 2014. This had the effect of reducing the number of shares in issue from 52,821,751,216 ordinary
shares (including 4,351,833,492 ordinary shares held in Treasury) as at the close of business on 18 February 2014 to 28,811,864,298 new ordinary shares in issue immediately after the share
consolidation on 24 February 2014.
During 2014, the Company issued 14,732,741,283 B shares of US$1.88477 per share and 33,737,176,433 C shares of US$0.00001 per share as part
of the Return of Value following the disposal of our US Group, whose principal asset was its 45% stake in Verizon Wireless (‘VZW’). The B shares were
cancelled as part of the Return of Value. The C shares were reclassied as deferred shares with no substantive rights as part of the Return of Value
and transferred to LDC (Shares) Limited (‘LDC’). On 8 May 2015, the Company repurchased and then subsequently cancelled all deferred shares.
Allotted during the year
The Company allotted the following share awards and option schemes:
Nominal Net
value proceeds
Number £m £m
UK share awards and option scheme awards 863,070 – 2
Overview Strategy review Performance Governance Financials Additional information Vodafone Group Plc
Annual Report 2015
183