Vodafone 2015 Annual Report Download - page 117
Download and view the complete annual report
Please find page 117 of the 2015 Vodafone annual report below. You can navigate through the pages in the report by either clicking on the pages listed below, or by using the keyword search tool below to find specific information within the annual report.-
 1
1 -
2
-
3
-
4
-
5
-
6
-
7
-
8
-
9
-
10
-
11
-
12
-
13
-
14
-
15
-
16
-
17
-
18
-
19
-
20
-
21
-
22
-
23
-
24
-
25
-
26
-
27
-
28
-
29
-
30
-
31
-
32
-
33
-
34
-
35
-
36
-
37
-
38
-
39
-
40
-
41
-
42
-
43
-
44
-
45
-
46
-
47
-
48
-
49
-
50
-
51
-
52
-
53
-
54
-
55
-
56
-
57
-
58
-
59
-
60
-
61
-
62
-
63
-
64
-
65
-
66
-
67
-
68
-
69
-
70
-
71
-
72
-
73
-
74
-
75
-
76
-
77
-
78
-
79
-
80
-
81
-
82
-
83
-
84
-
85
-
86
-
87
-
88
-
89
-
90
-
91
-
92
-
93
-
94
-
95
-
96
-
97
-
98
-
99
-
100
-
101
-
102
-
103
-
104
-
105
-
106
-
 107
107 -
 108
108 -
 109
109 -
 110
110 -
 111
111 -
 112
112 -
 113
113 -
 114
114 -
 115
115 -
 116
116 -
 117
117 -
 118
118 -
 119
119 -
 120
120 -
 121
121 -
 122
122 -
 123
123 -
 124
124 -
 125
125 -
 126
126 -
 127
127 -
128
-
129
-
130
-
131
-
132
-
133
-
134
-
135
-
136
-
137
-
138
-
139
-
140
-
141
-
142
-
143
-
144
-
145
-
146
-
147
-
148
-
149
-
150
-
151
-
152
-
153
-
154
-
155
-
156
-
157
-
158
-
159
-
160
-
161
-
162
-
163
-
164
-
165
-
166
-
167
-
168
-
169
-
170
-
171
-
172
-
173
-
174
-
175
-
176
-
177
-
178
-
179
-
180
-
181
-
182
-
183
-
184
-
185
-
186
-
187
-
188
-
189
-
190
-
191
-
192
-
193
-
194
-
195
-
196
-
197
-
198
-
199
-
200
-
201
-
202
-
203
-
204
-
205
-
206
-
207
-
208
-
209
-
210
-
211
-
212
-
213
-
214
-
215
-
216
 |
 |

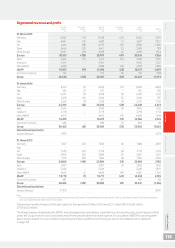
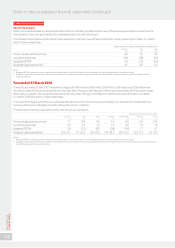
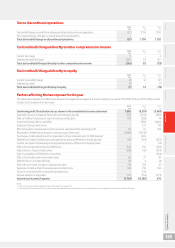
Segmental revenue and prot
Segment Intra-region Regional Inter-region Group
revenue revenue revenue revenue revenue EBITDA
£m £m £m £m £m £m
31 March 2015
Germany 8,467 (19) 8,448 (22) 8,426 2,670
Italy 4,641 (13) 4,628 (1) 4,627 1,537
UK 6,414 (38) 6,376 (20) 6,356 1,360
Spain 3,664 (23) 3,641 (2) 3,639 783
Other Europe 5,007 (29) 4,978 (2) 4,976 1,574
Europe 28,193 (122) 28,071 (47) 28,024 7,924
India 4,324 (11) 4,313 (15) 4,298 1,281
Vodacom 4,341 –4,341 –4,341 1,527
Other AMAP 4,828 –4,828 (10) 4,818 1,289
AMAP 13,493 (11) 13,482 (25) 13,457 4,097
Common Functions 754 –754 (8) 746 (106)
Group 42,440 (133) 42,307 (80) 42,227 11,915
31 March 2014
Germany 8,272 (9) 8,263 (11) 8,252 2,698
Italy 522 (1) 521 –521 182
UK 6,427 (9) 6,418 (3) 6,415 1,418
Spain 3,518 (14) 3,504 (2) 3,502 787
Other Europe 5,525 (9) 5,516 (4) 5,512 1,736
Europe 24,264 (42) 24,222 (20) 24,202 6,821
India 3,945 – 3,945 (3) 3,942 1,135
Vodacom 4,718 – 4,718 – 4,718 1,716
Other AMAP 4,810 – 4,810 (10) 4,800 1,294
AMAP 13,473 – 13,473 (13) 13,460 4,145
Common Functions 686 – 686 (2) 684 118
Group 38,423 (42) 38,381 (35) 38,346 11,084
Discontinued operations
Verizon Wireless
1
9,955 4,274
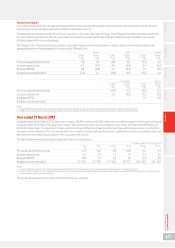
31 March 2013
Germany 7, 8 57 (25) 7, 8 32 (6) 7, 8 26 2,831
Italy – – – – – –
UK 5,150 (27) 5,12 3 (4) 5 ,119 1,210
Spain 3,904 (35) 3,869 (2) 3,867 1,021
Other Europe 7,115 (55) 7, 0 6 0 (6) 7,054 2 ,120
Europe 24,026 (142) 23,884 (18) 23,866 7,182
India 3,907 – 3,907 (4) 3,903 1,055
Vodacom 5,206 – 5,206 – 5,206 1,891
Other AMAP 4,605 (1) 4,604 (19) 4,585 1,250
AMAP 13,718 (1) 13,717 (23) 13,694 4,196
Common Functions 481 – 481 – 481 88
Group 38,225 (143) 38,082 (41) 38,041 11,466
Discontinued operations
Verizon Wireless
1
21,972 8,831
Note:
1 Discontinued operations comprise our US group whose principal asset was a 45% interest in Verizon Wireless, which was sold on 21 February 2014. Refer to note 7 “Discontinued operations”
to the consolidated nancial statements for further details.
Total revenue recorded in respect of the sale of goods for the year ended 31 March 2015 was £3,211 million (2014: £2,660 million,
2013: £2,633 million).
The Group’s measure of segment prot, EBITDA, excludes depreciation, amortisation, impairment loss, restructuring costs, loss on disposal of xed
assets, the Group’s share of results in associates and joint ventures and other income and expense. A reconciliation of EBITDA to operating prot/
(loss) is shown overleaf. For a reconciliation of operating prot/(loss) to prot for the nancial year, see the consolidated income statement
on page 105.
Overview Strategy review Performance Governance Financials Additional information Vodafone Group Plc
Annual Report 2015
115