Vodafone 2015 Annual Report Download - page 109
Download and view the complete annual report
Please find page 109 of the 2015 Vodafone annual report below. You can navigate through the pages in the report by either clicking on the pages listed below, or by using the keyword search tool below to find specific information within the annual report.-
 1
1 -
2
-
3
-
4
-
5
-
6
-
7
-
8
-
9
-
10
-
11
-
12
-
13
-
14
-
15
-
16
-
17
-
18
-
19
-
20
-
21
-
22
-
23
-
24
-
25
-
26
-
27
-
28
-
29
-
30
-
31
-
32
-
33
-
34
-
35
-
36
-
37
-
38
-
39
-
40
-
41
-
42
-
43
-
44
-
45
-
46
-
47
-
48
-
49
-
50
-
51
-
52
-
53
-
54
-
55
-
56
-
57
-
58
-
59
-
60
-
61
-
62
-
63
-
64
-
65
-
66
-
67
-
68
-
69
-
70
-
71
-
72
-
73
-
74
-
75
-
76
-
77
-
78
-
79
-
80
-
81
-
82
-
83
-
84
-
85
-
86
-
87
-
88
-
89
-
90
-
91
-
92
-
93
-
94
-
95
-
96
-
97
-
98
-
 99
99 -
 100
100 -
 101
101 -
 102
102 -
 103
103 -
 104
104 -
 105
105 -
 106
106 -
 107
107 -
 108
108 -
 109
109 -
 110
110 -
 111
111 -
 112
112 -
 113
113 -
 114
114 -
 115
115 -
 116
116 -
 117
117 -
 118
118 -
 119
119 -
120
-
121
-
122
-
123
-
124
-
125
-
126
-
127
-
128
-
129
-
130
-
131
-
132
-
133
-
134
-
135
-
136
-
137
-
138
-
139
-
140
-
141
-
142
-
143
-
144
-
145
-
146
-
147
-
148
-
149
-
150
-
151
-
152
-
153
-
154
-
155
-
156
-
157
-
158
-
159
-
160
-
161
-
162
-
163
-
164
-
165
-
166
-
167
-
168
-
169
-
170
-
171
-
172
-
173
-
174
-
175
-
176
-
177
-
178
-
179
-
180
-
181
-
182
-
183
-
184
-
185
-
186
-
187
-
188
-
189
-
190
-
191
-
192
-
193
-
194
-
195
-
196
-
197
-
198
-
199
-
200
-
201
-
202
-
203
-
204
-
205
-
206
-
207
-
208
-
209
-
210
-
211
-
212
-
213
-
214
-
215
-
216
 |
 |

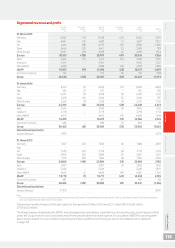
Consolidated statement of changes in equity
for the years ended 31 March
Other comprehensive income Equity
Additional share- Non-
Share paid-in Treasury Retained Currency Pensions Investment Revaluation holders’ controlling
capital1capital2shares losses reserve3reserve reserve4surplus5Other6 funds interests Total
£m £m £m £m £m £m £m £m £m £m £m £m
1 April 2012 3,866 15 4,12 3 (7,841) (84,217) 10 ,138 (466) 220 1,040 72 76,935 1,267 78,202
Issue or reissue of shares – 2 287 (237) – – – – – 52 – 52
Purchase of own shares – – (1,475)7– – – – – – (1,475) – (1,475)
Share-based payments – 1528 – – – – – – – 152 – 152
Transactions with non-controlling
interests in subsidiaries – – – (7) – – – – – (7) (17) (24)
Comprehensive income – – – 413 462 (182) (85) – (4) 604 145 74 9
Prot – – – 413 – – – – – 413 244 657
OCI – before tax – – – – 482 (238) (73) – (6) 165 (95) 70
OCI – taxes – – – – (21) 56 – – 2 37 (4) 33
Transfer to the income
statement – – – – 1 – (12) – – (11) – (11)
Dividends – – – (4,801) – – – – – (4,801) (384) (5,185)
Other – 2 – 15 – – – – – 17 – 17
31 March 2013 3,866 154,279 (9,029) (88,834) 10,600 (648) 135 1,040 68 71,477 1,011 72,488
Issue or reissue of shares – 2 194 (173) – – – – – 23 – 23
Redemption or cancellation of
shares ( 74 ) 74 1,648 (1,648) – – – – – – – –
Capital reduction and creation of
B and C shares 16,613 (37,470) – 20,857 – – – – – – – –
Cancellation of B shares (16,613) – – 1,115 – – – – – (15,498) – (15,498)
Share-based payments – 888 – – – – – – – 88 – 88
Transactions with non-controlling
interests in subsidiaries – – – (1,451) – – – – – (1,451) 260 (1,191)
Comprehensive income – – – 59,254 (2,436) 37 (119) – (25) 5 6 ,7 11 (9) 56,702
Prot – – – 59,254 – – – – – 59,254 166 59,420
OCI – before tax – – – – (3,932) 57 (119) – 3 (3,991) (172) (4,163)
OCI – taxes – – – – 3 (20) – – (3) (20) (3) (23)
Transfer to the income
statement – – – – 1,493 – – – (25) 1,468 – 1,468
Dividends – – – (40,566) – – – – – (40,566) (284) (40,850)
Other – – – 18 – – – – – 18 1 19
31 March 2014 3,792 116,973 (7,187) (51,428) 8,164 (611) 16 1,040 43 70,802 979 71,781
Issue or reissue of shares –2142 (126) –––––18 –18
Share-based payments –958– ––––––95 –95
Transactions with non-controlling
interests in subsidiaries – – (756) –––––(756) 605 (151)
Comprehensive income – – – 5,761 (6,627) (212) (5) – 7 (1,076) 266 (810)
Prot – – – 5,761 –––––5,761 156 5,917
OCI – before tax – – – – (6,842) (269) 4 – 12 (7,095) 113 (6,982)
OCI – taxes – – – – 216 57 – – (5) 268 (3) 265
Transfer to the income
statement – – – – (1) –(9) – – (10) –(10)
Dividends – – – (2,930) – – – – (2,930) (262) (3,192)
Other –(16) – 8 – – – – – (8) –(8)
31 March 2015 3,792 117,054 (7,045) (49,471) 1,537 (823) 11 1,040 50 66,145 1,588 67,733
Notes:
1 See note 18 “Called up share capital”.
2 Includes share premium, capital redemption reserve and merger reserve. The merger reserve was derived from acquisitions made prior to 31 March 2004 and subsequently allocated
to additional paid-in capital on adoption of IFRS.
3 The currency reserve is used to record cumulative translation differences on the assets and liabilities of foreign operations. The cumulative translation differences are recycled to the income
statement on disposal of the foreign operation.
4 The investment reserve is used to record the cumulative fair value gains and losses on available-for-sale nancial assets. The cumulative gains and losses are recycled to the income statement
on disposal of the assets.
5 The revaluation surplus derives from acquisitions of subsidiaries made before the Group’s adoption of IFRS 3 (Revised) on 1 April 2010 and comprises the amounts arising from recognising the
Group’s pre-existing equity interest in the acquired subsidiary at fair value.
6 Includes the impact of the Group’s cash ow hedges with £607 million net gain deferred to other comprehensive income during the year (2014: £129 million net loss) and £649 million net gain
(2014: £171 million net loss) recycled to the income statement.
7 Amount for 2013 includes a commitment for the purchase of own shares of £1,026 million.
8 Includes £7 million tax credit (2014: £12 million charge; 2013: £18 million credit).
Overview Strategy review Performance Governance Financials Additional information Vodafone Group Plc
Annual Report 2015
107