Vodafone 2015 Annual Report Download - page 10
Download and view the complete annual report
Please find page 10 of the 2015 Vodafone annual report below. You can navigate through the pages in the report by either clicking on the pages listed below, or by using the keyword search tool below to find specific information within the annual report.-
 1
1 -
 2
2 -
 3
3 -
 4
4 -
 5
5 -
 6
6 -
 7
7 -
 8
8 -
 9
9 -
 10
10 -
 11
11 -
 12
12 -
 13
13 -
 14
14 -
 15
15 -
 16
16 -
 17
17 -
 18
18 -
 19
19 -
 20
20 -
 21
21 -
22
-
23
-
24
-
25
-
26
-
27
-
28
-
29
-
30
-
31
-
32
-
33
-
34
-
35
-
36
-
37
-
38
-
39
-
40
-
41
-
42
-
43
-
44
-
45
-
46
-
47
-
48
-
49
-
50
-
51
-
52
-
53
-
54
-
55
-
56
-
57
-
58
-
59
-
60
-
61
-
62
-
63
-
64
-
65
-
66
-
67
-
68
-
69
-
70
-
71
-
72
-
73
-
74
-
75
-
76
-
77
-
78
-
79
-
80
-
81
-
82
-
83
-
84
-
85
-
86
-
87
-
88
-
89
-
90
-
91
-
92
-
93
-
94
-
95
-
96
-
97
-
98
-
99
-
100
-
101
-
102
-
103
-
104
-
105
-
106
-
107
-
108
-
109
-
110
-
111
-
112
-
113
-
114
-
115
-
116
-
117
-
118
-
119
-
120
-
121
-
122
-
123
-
124
-
125
-
126
-
127
-
128
-
129
-
130
-
131
-
132
-
133
-
134
-
135
-
136
-
137
-
138
-
139
-
140
-
141
-
142
-
143
-
144
-
145
-
146
-
147
-
148
-
149
-
150
-
151
-
152
-
153
-
154
-
155
-
156
-
157
-
158
-
159
-
160
-
161
-
162
-
163
-
164
-
165
-
166
-
167
-
168
-
169
-
170
-
171
-
172
-
173
-
174
-
175
-
176
-
177
-
178
-
179
-
180
-
181
-
182
-
183
-
184
-
185
-
186
-
187
-
188
-
189
-
190
-
191
-
192
-
193
-
194
-
195
-
196
-
197
-
198
-
199
-
200
-
201
-
202
-
203
-
204
-
205
-
206
-
207
-
208
-
209
-
210
-
211
-
212
-
213
-
214
-
215
-
216
 |
 |

Our business model
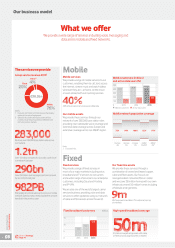
What we offer
We provide a wide range of services including voice, messaging and
data across mobile and xed networks.
We have over 283,000 base station sites across
our markets
Over 1.2 trillion minutes of voice calls carried over
our network last year
Over 290 billion text messages sent and received
by our network last year
982 petabytes of data were sent across our mobile
network alone last year, nearly double the amount
handled in the previous year
Group service revenue 20151Mobile
Fixed
Mobile services
We provide a range of mobile services to our
customers, enabling them to call, text, access
the internet, stream music and watch videos
wherever they are – at home, on the move
or even abroad with our roaming services.
Our mobile assets
We provide these services through our
network of over 283,000 base station sites
providing near nationwide voice coverage and
extensive data coverage across Europe and
extensive coverage across our AMAP region.
Fixed services
We provide a range of xed services in
mostof our major markets including voice,
broadband and TV services to consumers
and a wider range of services to our enterprise
customers, including Cloud and Hosting
and IP-VPN.
We are also one of the world’s largest carrier
services business, providing voice and data
services to other operators using our network
of cable and bre assets across the world.
Our xed line assets
We provide these services through a
combination of owned and leased copper,
cable and bre assets. Our focus is on
next-generation networks (bre or cable)
and we cover 28 million homes with our own
infrastructure and 50 million homes including
wholesale arrangements.
We have over nine million TV customers across
six markets
40% of our customers now use mobile data
More on Strategy:
Page 14
High-speed broadband coverageFixed broadband customers million
50 million households passed with cable
or bre across Europe (owned or leased)
Notes:
1 Excludes £3.7 billion of other revenue that mainly
relates to the sale of equipment.
2 Other service revenue includes revenue from
mobilevirtual network operators (‘MVNOs’) and
fromour partner markets.
Mobile customers (million)
andactive data users (%)
Note:
3 Excludes India.
6.9
2013 2014 2015
9.2
12.0
0
5
10
15
30%
407.3
2013 2014 2015
430.8
36%
445.8
40%
Mobile customers Active data users
0
100
400
300
200
500
Mobile network population coverage
Europe
4G Europe
3G Europe
2G AMAP
3G/4G3AMAP
2G3
72% 94% 100% 82% 97%
Other2
4%
Mobile
76%
Fixed
20%
£38.5bn
The services we provide
Vodafone Group Plc
Annual Report 2015
08