Vodafone 2015 Annual Report Download - page 156
Download and view the complete annual report
Please find page 156 of the 2015 Vodafone annual report below. You can navigate through the pages in the report by either clicking on the pages listed below, or by using the keyword search tool below to find specific information within the annual report.-
 1
1 -
2
-
3
-
4
-
5
-
6
-
7
-
8
-
9
-
10
-
11
-
12
-
13
-
14
-
15
-
16
-
17
-
18
-
19
-
20
-
21
-
22
-
23
-
24
-
25
-
26
-
27
-
28
-
29
-
30
-
31
-
32
-
33
-
34
-
35
-
36
-
37
-
38
-
39
-
40
-
41
-
42
-
43
-
44
-
45
-
46
-
47
-
48
-
49
-
50
-
51
-
52
-
53
-
54
-
55
-
56
-
57
-
58
-
59
-
60
-
61
-
62
-
63
-
64
-
65
-
66
-
67
-
68
-
69
-
70
-
71
-
72
-
73
-
74
-
75
-
76
-
77
-
78
-
79
-
80
-
81
-
82
-
83
-
84
-
85
-
86
-
87
-
88
-
89
-
90
-
91
-
92
-
93
-
94
-
95
-
96
-
97
-
98
-
99
-
100
-
101
-
102
-
103
-
104
-
105
-
106
-
107
-
108
-
109
-
110
-
111
-
112
-
113
-
114
-
115
-
116
-
117
-
118
-
119
-
120
-
121
-
122
-
123
-
124
-
125
-
126
-
127
-
128
-
129
-
130
-
131
-
132
-
133
-
134
-
135
-
136
-
137
-
138
-
139
-
140
-
141
-
142
-
143
-
144
-
145
-
 146
146 -
 147
147 -
 148
148 -
 149
149 -
 150
150 -
 151
151 -
 152
152 -
 153
153 -
 154
154 -
 155
155 -
 156
156 -
 157
157 -
 158
158 -
 159
159 -
 160
160 -
 161
161 -
 162
162 -
 163
163 -
 164
164 -
 165
165 -
 166
166 -
167
-
168
-
169
-
170
-
171
-
172
-
173
-
174
-
175
-
176
-
177
-
178
-
179
-
180
-
181
-
182
-
183
-
184
-
185
-
186
-
187
-
188
-
189
-
190
-
191
-
192
-
193
-
194
-
195
-
196
-
197
-
198
-
199
-
200
-
201
-
202
-
203
-
204
-
205
-
206
-
207
-
208
-
209
-
210
-
211
-
212
-
213
-
214
-
215
-
216
 |
 |

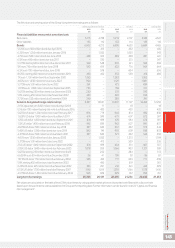
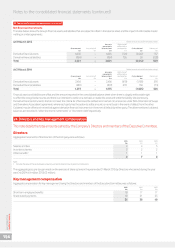
23. Capital and nancial risk management (continued)
The Group manages liquidity risk on long-term borrowings by maintaining a varied maturity prole with a cap on the level of debt maturing in any
one calendar year, therefore minimising renancing risk. Long-term borrowings mature between one and 28 years.
Liquidity is reviewed daily on at least a 12 month rolling basis and stress tested on the assumption that all commercial paper outstanding
matures and is not reissued. The Group maintains substantial cash and cash equivalents which at 31 March 2015, amounted to £6,882 million
(2014: £10,134 million).
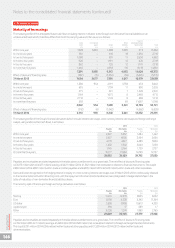
Market risk
Interest rate management
Under the Group’s interest rate management policy, interest rates on monetary assets and liabilities denominated in euros, US dollars and sterling
are maintained on a oating rate basis except for periods up to six years where interest rate xing has to be undertaken in accordance with treasury
policy. Where assets and liabilities are denominated in other currencies interest rates may also be xed. In addition, xing is undertaken for longer
periods when interest rates are statistically low.
For each one hundred basis point fall or rise in market interest rates for all currencies in which the Group had borrowings at 31 March 2015 there
would be an increase or decrease in prot before tax by approximately £36 million (2014: increase or decrease by £42 million) including mark-to-
market revaluations of interest rate and other derivatives and the potential interest on outstanding tax issues. There would be no material impact
on equity.
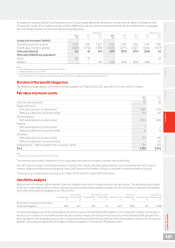
Foreign exchange management
As Vodafone’s primary listing is on the London Stock Exchange its share price is quoted in sterling. Since the sterling share price represents the value
of its future multi-currency cash ows, principally in euro, South African rand, Indian rupee and sterling, the Group maintains the currency of debt
and interest charges in proportion to its expected future principal multi-currency cash ows and has a policy to hedge external foreign exchange
risks on transactions denominated in other currencies above certain de minimis levels. As the Group’s future cash ows are increasingly likely
to be derived from emerging markets it is likely that a greater proportion of debt in emerging market currencies will be drawn.
At 31 March 2015, 129% of net debt was denominated in currencies other than sterling (86% euro, 23% India rupee 11% US dollar and 9% other)
while 29% of net debt had been purchased forward in sterling in anticipation of sterling denominated shareholder returns via dividends. This allows
euro, US dollar and other debt to be serviced in proportion to expected future cash ows and therefore provides a partial hedge against income
statement translation exposure, as interest costs will be denominated in foreign currencies.
Under the Group’s foreign exchange management policy, foreign exchange transaction exposure in Group companies is generally maintained at the
lower of €5 million per currency per month or €15 million per currency over a six month period.
The Group recognises foreign exchange movements in equity for the translation of net investment hedging instruments and balances treated
as investments in foreign operations. However, there is no net impact on equity for exchange rate movements on net investment hedging
instruments as there would be an offset in the currency translation of the foreign operation. At 31 March 2015 the Group held nancial liabilities
in a net investment against the Group’s consolidated euro net assets. Sensitivity to foreign exchange movements on the hedging liabilities, analysed
against a strengthening of the euro by 5% (FY14: 3%) would result in a decrease in equity of £876 million (FY14: £333 million) which would be fully
offset by foreign exchange movements on the hedged net assets.
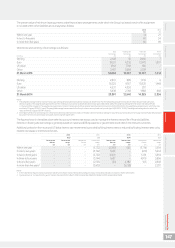
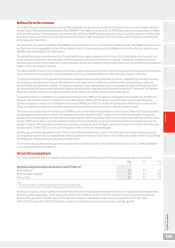
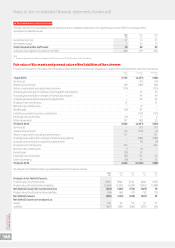
The following table details the Group’s sensitivity of the Group’s adjusted operating prot to a strengthening of the Group’s major currency in which
it transacts. The percentage movement applied to the currency is based on the average movements in the previous three annual reporting periods.
Amounts are calculated by retranslating the operating prot of each entity whose functional currency is euro.
2015 2014
£m £m
Euro 5% (2014: 3%) change – Operating prot181 60
Note:
1 Operating prot before impairment losses and other income and expense.
At 31 March 2015 the Group’s sensitivity to foreign exchange movements, analysed against a strengthening of the US dollar by 9% (FY14: 5%) on its
external US dollar exposure would decrease the prot before tax by £71 million (FY14: £4 million). Foreign exchange on certain internal balances
analysed against a strengthening of the US dollar of 9% (FY14: 5%) and euro of 5% (FY14: 3%) would decrease the prot before tax by £65 million
(FY14:US$190 million) and £186 million (FY14: £189 million) for US dollar and euro respectively.
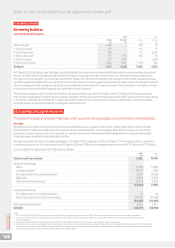
Equity risk
There is no material equity risk relating to the Group’s equity investments which are detailed in note 13 “Other investments”.
Notes to the consolidated nancial statements (continued)
Vodafone Group Plc
Annual Report 2015
154