Vodafone 2015 Annual Report Download - page 120
Download and view the complete annual report
Please find page 120 of the 2015 Vodafone annual report below. You can navigate through the pages in the report by either clicking on the pages listed below, or by using the keyword search tool below to find specific information within the annual report.-
 1
1 -
2
-
3
-
4
-
5
-
6
-
7
-
8
-
9
-
10
-
11
-
12
-
13
-
14
-
15
-
16
-
17
-
18
-
19
-
20
-
21
-
22
-
23
-
24
-
25
-
26
-
27
-
28
-
29
-
30
-
31
-
32
-
33
-
34
-
35
-
36
-
37
-
38
-
39
-
40
-
41
-
42
-
43
-
44
-
45
-
46
-
47
-
48
-
49
-
50
-
51
-
52
-
53
-
54
-
55
-
56
-
57
-
58
-
59
-
60
-
61
-
62
-
63
-
64
-
65
-
66
-
67
-
68
-
69
-
70
-
71
-
72
-
73
-
74
-
75
-
76
-
77
-
78
-
79
-
80
-
81
-
82
-
83
-
84
-
85
-
86
-
87
-
88
-
89
-
90
-
91
-
92
-
93
-
94
-
95
-
96
-
97
-
98
-
99
-
100
-
101
-
102
-
103
-
104
-
105
-
106
-
107
-
108
-
109
-
 110
110 -
 111
111 -
 112
112 -
 113
113 -
 114
114 -
 115
115 -
 116
116 -
 117
117 -
 118
118 -
 119
119 -
 120
120 -
 121
121 -
 122
122 -
 123
123 -
 124
124 -
 125
125 -
 126
126 -
 127
127 -
 128
128 -
 129
129 -
 130
130 -
131
-
132
-
133
-
134
-
135
-
136
-
137
-
138
-
139
-
140
-
141
-
142
-
143
-
144
-
145
-
146
-
147
-
148
-
149
-
150
-
151
-
152
-
153
-
154
-
155
-
156
-
157
-
158
-
159
-
160
-
161
-
162
-
163
-
164
-
165
-
166
-
167
-
168
-
169
-
170
-
171
-
172
-
173
-
174
-
175
-
176
-
177
-
178
-
179
-
180
-
181
-
182
-
183
-
184
-
185
-
186
-
187
-
188
-
189
-
190
-
191
-
192
-
193
-
194
-
195
-
196
-
197
-
198
-
199
-
200
-
201
-
202
-
203
-
204
-
205
-
206
-
207
-
208
-
209
-
210
-
211
-
212
-
213
-
214
-
215
-
216
 |
 |

Notes to the consolidated nancial statements (continued)
4. Impairment losses
Impairment occurs when the carrying value of assets is greater than the present value of the net cash ows they
are expected to generate. We review the carrying value of assets for each country in which we operate at least
annually. For further details on our impairment review process see “Critical accounting judgements and key
sources of estimation uncertainty” in note 1 “Basis of preparation” to the consolidated nancial statements.
Accounting policies
Goodwill
Goodwill is not subject to amortisation but is tested for impairment annually or whenever there is an indication that the asset may be impaired.
For the purpose of impairment testing, assets are grouped at the lowest levels for which there are separately identiable cash ows, known as cash-
generating units. If the recoverable amount of the cash-generating unit is less than the carrying amount of the unit, the impairment loss is allocated
rst to reduce the carrying amount of any goodwill allocated to the unit and then to the other assets of the unit pro-rata on the basis of the carrying
amount of each asset in the unit. Impairment losses recognised for goodwill are not reversible in subsequent periods.
The recoverable amount is the higher of fair value less costs to sell and value in use. In assessing value in use, the estimated future cash ows are
discounted to their present value using a pre-tax discount rate that reects current market assessments of the time value of money and the risks
specic to the asset for which the estimates of future cash ows have not been adjusted.
The Group prepares and approves formal ve year management plans for its operations, which are used in the value in use calculations. In certain
developing markets the fth year of the management plan may not be indicative of the long-term future performance as operations may not have
reached maturity. For these operations, the Group may extend the plan data for an additional ve year period.
Property, plant and equipment and nite lived intangible assets
At each reporting period date, the Group reviews the carrying amounts of its property, plant and equipment and nite lived intangible assets
to determine whether there is any indication that those assets have suffered an impairment loss. If any such indication exists, the recoverable
amount of the asset is estimated in order to determine the extent, if any, of the impairment loss. Where it is not possible to estimate the recoverable
amount of an individual asset, the Group estimates the recoverable amount of the cash-generating unit to which the asset belongs.
If the recoverable amount of an asset or cash-generating unit is estimated to be less than its carrying amount, the carrying amount of the asset
or cash-generating unit is reduced to its recoverable amount and an impairment loss is recognised immediately in the income statement.
Where an impairment loss subsequently reverses, the carrying amount of the asset or cash-generating unit is increased to the revised estimate of its
recoverable amount, not to exceed the carrying amount that would have been determined had no impairment loss been recognised for the asset
or cash-generating unit in prior years and an impairment loss reversal is recognised immediately in the income statement.
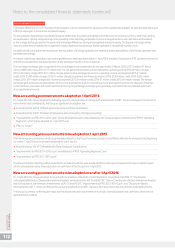
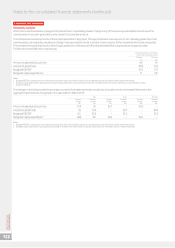
Impairment losses
Following our annual impairment review no impairment charges were recorded in respect of the Group’s goodwill balances during the year ended
31 March 2015. The impairment losses recognised in the consolidated income statement within operating prot in respect of goodwill in the years
ended 31 March 2014 and 31 March 2013 are stated below. The impairment losses were based on value in use calculations.
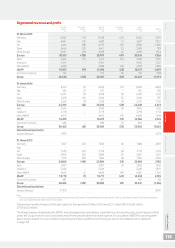
2015 2014 2013
Cash-generating unit Reportable segment £m £m £m
Germany Germany –4,900 –
Italy Italy – – 4,500
Spain Spain –800 3,200
Portugal Other Europe –500 –
Czech Republic Other Europe –200 –
Romania Other Europe –200 –
–6,600 7,700
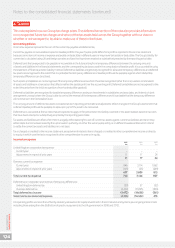
Goodwill
The remaining carrying value of goodwill at 31 March was as follows:
2015 2014
£m £m
Germany 9,019 10,306
Italy 2,641 3,017
Spain 2,755 1,662
14,415 14,985
Other 8,122 8,330
22,537 23,315
Vodafone Group Plc
Annual Report 2015
118