Vodafone 2015 Annual Report Download - page 125
Download and view the complete annual report
Please find page 125 of the 2015 Vodafone annual report below. You can navigate through the pages in the report by either clicking on the pages listed below, or by using the keyword search tool below to find specific information within the annual report.-
 1
1 -
2
-
3
-
4
-
5
-
6
-
7
-
8
-
9
-
10
-
11
-
12
-
13
-
14
-
15
-
16
-
17
-
18
-
19
-
20
-
21
-
22
-
23
-
24
-
25
-
26
-
27
-
28
-
29
-
30
-
31
-
32
-
33
-
34
-
35
-
36
-
37
-
38
-
39
-
40
-
41
-
42
-
43
-
44
-
45
-
46
-
47
-
48
-
49
-
50
-
51
-
52
-
53
-
54
-
55
-
56
-
57
-
58
-
59
-
60
-
61
-
62
-
63
-
64
-
65
-
66
-
67
-
68
-
69
-
70
-
71
-
72
-
73
-
74
-
75
-
76
-
77
-
78
-
79
-
80
-
81
-
82
-
83
-
84
-
85
-
86
-
87
-
88
-
89
-
90
-
91
-
92
-
93
-
94
-
95
-
96
-
97
-
98
-
99
-
100
-
101
-
102
-
103
-
104
-
105
-
106
-
107
-
108
-
109
-
110
-
111
-
112
-
113
-
114
-
 115
115 -
 116
116 -
 117
117 -
 118
118 -
 119
119 -
 120
120 -
 121
121 -
 122
122 -
 123
123 -
 124
124 -
 125
125 -
 126
126 -
 127
127 -
 128
128 -
 129
129 -
 130
130 -
 131
131 -
 132
132 -
 133
133 -
 134
134 -
 135
135 -
136
-
137
-
138
-
139
-
140
-
141
-
142
-
143
-
144
-
145
-
146
-
147
-
148
-
149
-
150
-
151
-
152
-
153
-
154
-
155
-
156
-
157
-
158
-
159
-
160
-
161
-
162
-
163
-
164
-
165
-
166
-
167
-
168
-
169
-
170
-
171
-
172
-
173
-
174
-
175
-
176
-
177
-
178
-
179
-
180
-
181
-
182
-
183
-
184
-
185
-
186
-
187
-
188
-
189
-
190
-
191
-
192
-
193
-
194
-
195
-
196
-
197
-
198
-
199
-
200
-
201
-
202
-
203
-
204
-
205
-
206
-
207
-
208
-
209
-
210
-
211
-
212
-
213
-
214
-
215
-
216
 |
 |

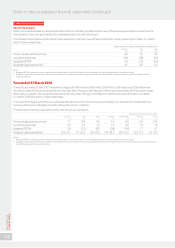
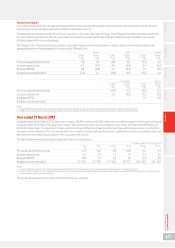
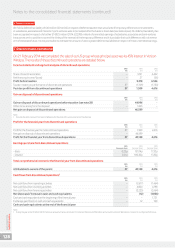
5. Investment income and nancing costs
Investment income comprises interest received from short-term investments, bank deposits, government bonds
and gains from foreign exchange contracts which are used to hedge net debt. Financing costs mainly arise from
interest due on bonds and commercial paper issued, bank loans and the results of hedging transactions used to
manage foreign exchange and interest rate movements.
2015 2014 2013
£m £m £m
Investment income:
Available-for-sale investments:
Dividends received –10 2
Loans and receivables at amortised cost 324 184 124
Fair value through the income statement (held for trading):
Derivatives – foreign exchange contracts –82 115
Other1559 70 64
883 346 305
Financing costs:
Items in hedge relationships:
Other loans 245 265 228
Interest rate and cross currency interest rate swaps (123) (196) (184)
Fair value hedging instrument (461) 386 (81)
Fair value of hedged item 418 (363) 112
Other nancial liabilities held at amortised cost:
Bank loans and overdrafts2842 557 584
Other loans3677 770 736
Interest credit on settlement of tax issues4(4) (15) (91)
Equity put rights and similar arrangements511 143 136
Fair value through the income statement (held for trading):
Derivatives – forward starting swaps and futures 131 1105
Other1– 6 51
1,736 1,554 1,596
Net nancing costs 853 1,208 1,291
Notes:
1 Amounts for 2015 include net foreign exchange gains of £526 million (2014: £21 million gain; 2013: £91 million loss) arising from net foreign exchange movements on certain
intercompany balances.
2 The Group capitalised £142 million of interest expense in the year (2014: £3 million; 2013: £8 million).
3 Amounts for 2015 include net foreign exchange losses of £250 million (2014: £201 million; 2013: £nil).
4 Amounts for 2015, 2014 and 2013 include a reduction of the provision for potential interest on tax issues.
5 Includes amounts in relation to the Group’s arrangements with its non-controlling interests.
Overview Strategy review Performance Governance Financials Additional information Vodafone Group Plc
Annual Report 2015
123