Vodafone 2015 Annual Report Download - page 148
Download and view the complete annual report
Please find page 148 of the 2015 Vodafone annual report below. You can navigate through the pages in the report by either clicking on the pages listed below, or by using the keyword search tool below to find specific information within the annual report.-
 1
1 -
2
-
3
-
4
-
5
-
6
-
7
-
8
-
9
-
10
-
11
-
12
-
13
-
14
-
15
-
16
-
17
-
18
-
19
-
20
-
21
-
22
-
23
-
24
-
25
-
26
-
27
-
28
-
29
-
30
-
31
-
32
-
33
-
34
-
35
-
36
-
37
-
38
-
39
-
40
-
41
-
42
-
43
-
44
-
45
-
46
-
47
-
48
-
49
-
50
-
51
-
52
-
53
-
54
-
55
-
56
-
57
-
58
-
59
-
60
-
61
-
62
-
63
-
64
-
65
-
66
-
67
-
68
-
69
-
70
-
71
-
72
-
73
-
74
-
75
-
76
-
77
-
78
-
79
-
80
-
81
-
82
-
83
-
84
-
85
-
86
-
87
-
88
-
89
-
90
-
91
-
92
-
93
-
94
-
95
-
96
-
97
-
98
-
99
-
100
-
101
-
102
-
103
-
104
-
105
-
106
-
107
-
108
-
109
-
110
-
111
-
112
-
113
-
114
-
115
-
116
-
117
-
118
-
119
-
120
-
121
-
122
-
123
-
124
-
125
-
126
-
127
-
128
-
129
-
130
-
131
-
132
-
133
-
134
-
135
-
136
-
137
-
 138
138 -
 139
139 -
 140
140 -
 141
141 -
 142
142 -
 143
143 -
 144
144 -
 145
145 -
 146
146 -
 147
147 -
 148
148 -
 149
149 -
 150
150 -
 151
151 -
 152
152 -
 153
153 -
 154
154 -
 155
155 -
 156
156 -
 157
157 -
 158
158 -
159
-
160
-
161
-
162
-
163
-
164
-
165
-
166
-
167
-
168
-
169
-
170
-
171
-
172
-
173
-
174
-
175
-
176
-
177
-
178
-
179
-
180
-
181
-
182
-
183
-
184
-
185
-
186
-
187
-
188
-
189
-
190
-
191
-
192
-
193
-
194
-
195
-
196
-
197
-
198
-
199
-
200
-
201
-
202
-
203
-
204
-
205
-
206
-
207
-
208
-
209
-
210
-
211
-
212
-
213
-
214
-
215
-
216
 |
 |
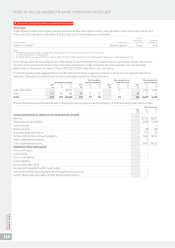
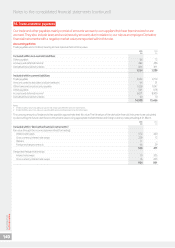
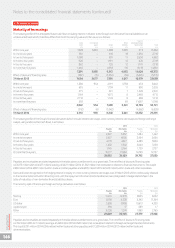
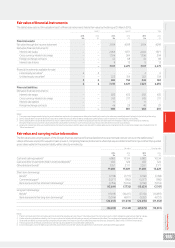
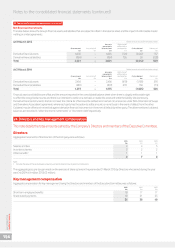
21. Borrowings (continued)
Maturity of borrowings
The maturity prole of the anticipated future cash ows including interest in relation to the Group’s non-derivative nancial liabilities on an
undiscounted basis which, therefore, differs from both the carrying value and fair value, is as follows:
Loans in
Bank Commercial Other designated hedge
loans paper Bonds liabilities relationships Total
£m £m £m £m £m £m
Within one year 1,928 5,092 1,588 3,885 873 13,366
In one to two years 831 – 610 18 1,256 2,715
In two to three years 1,090 – 831 11 2,650 4,582
In three to four years 920 – 1,191 12 626 2,749
In four to ve years 862 – 135 12 1,101 2,110
In more than ve years 1,660 – 4,958 115 8,118 14,851
7,291 5,092 9,313 4,053 14,624 40,373
Effect of discount/nancing rates (287) (15) (1,332) (36) (3,645) (5,315)
31 March 2015 7,004 5,077 7,981 4,017 10,979 35,058
Within one year 1,286 954 2,191 3,758 453 8,642
In one to two years 695 – 1,709 11 890 3,305
In two to three years 375 – 591 71,228 2,201
In three to four years 1,164 – 1,075 82,468 4,715
In four to ve years 2,710 – 1,724 8668 5,110
In more than ve years 592 – – 69 11,087 11,748
6,822 954 7,290 3,861 16,794 35,721
Effect of discount/nancing rates (912) (4) (1,042) – (4,562) (6,520)
31 March 2014 5,910 950 6,248 3,861 12,232 29,201
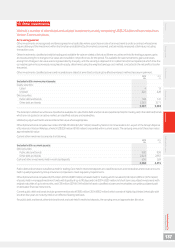
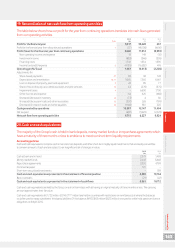
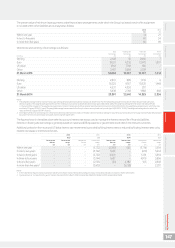
The maturity prole of the Group’s nancial derivatives (which include interest rate swaps, cross currency interest rate swaps and foreign exchange
swaps), using undiscounted cash ows, is as follows:
2015 2014
Payable Receivable Payable Receivable
£m £m £m £m
Within one year 2,647 3,537 1,284 1,442
In one to two years 5,457 4,005 2,454 3,656
In two to three years 4,179 4,617 4,489 3,920
In three to four years 1,430 1,942 5,040 3,138
In four to ve years 1,145 2,164 1,729 2,137
In more than ve years 13,177 17,864 14,799 12,737
28,035 34,129 29,795 27,030
Payables and receivables are stated separately in the table above as settlement is on a gross basis. The net effect of discount/nancing rates
is £3,073 million (2014: £4,327 million), leaving a £3,021 million (2014: £1,562 million) net receivable in relation to nancial instruments. This is split
£984 million (2014: £881 million) within trade and other payables and £4,005 million (2014: £2,443 million) within trade and other receivables.
Gains and losses recognised in the hedging reserve in equity on cross currency interest rate swaps as at 31 March 2015 will be continuously released
to the income statement within nancing costs until the repayment of certain bonds classied as loans designated in hedge relationships in the
table of maturities of non-derivative nancial liabilities above.
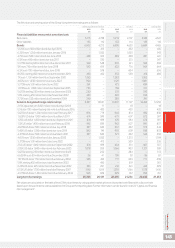
The currency split of the Group’s foreign exchange derivatives is as follows:
2015 2014
Payable Receivable Payable Receivable
£m £m £m £m
Sterling 11, 4 61 12,578 8,955 9,222
Euro 8,158 6,228 5,342 11,364
US dollar 5,598 9,908 10,613 4,330
Japanese yen 594 17 589 17
Other 3,238 1,374 1,880 2,765
29,049 30,105 27,379 27,698
Payables and receivables are stated separately in the table above as settlement is on a gross basis. The net effect of discount/nancing rates
is £192 million (2014: £7 million), leaving a £1,248 million (2014: £326 million) net receivable in relation to foreign exchange nancial instruments.
This is split £291 million (2014: £246 million) within trade and other payables and £1,539 million (2014: £572 million) within trade and
other receivables.
Notes to the consolidated nancial statements (continued)
Vodafone Group Plc
Annual Report 2015
146