Vodafone 2015 Annual Report Download - page 177
Download and view the complete annual report
Please find page 177 of the 2015 Vodafone annual report below. You can navigate through the pages in the report by either clicking on the pages listed below, or by using the keyword search tool below to find specific information within the annual report.-
 1
1 -
2
-
3
-
4
-
5
-
6
-
7
-
8
-
9
-
10
-
11
-
12
-
13
-
14
-
15
-
16
-
17
-
18
-
19
-
20
-
21
-
22
-
23
-
24
-
25
-
26
-
27
-
28
-
29
-
30
-
31
-
32
-
33
-
34
-
35
-
36
-
37
-
38
-
39
-
40
-
41
-
42
-
43
-
44
-
45
-
46
-
47
-
48
-
49
-
50
-
51
-
52
-
53
-
54
-
55
-
56
-
57
-
58
-
59
-
60
-
61
-
62
-
63
-
64
-
65
-
66
-
67
-
68
-
69
-
70
-
71
-
72
-
73
-
74
-
75
-
76
-
77
-
78
-
79
-
80
-
81
-
82
-
83
-
84
-
85
-
86
-
87
-
88
-
89
-
90
-
91
-
92
-
93
-
94
-
95
-
96
-
97
-
98
-
99
-
100
-
101
-
102
-
103
-
104
-
105
-
106
-
107
-
108
-
109
-
110
-
111
-
112
-
113
-
114
-
115
-
116
-
117
-
118
-
119
-
120
-
121
-
122
-
123
-
124
-
125
-
126
-
127
-
128
-
129
-
130
-
131
-
132
-
133
-
134
-
135
-
136
-
137
-
138
-
139
-
140
-
141
-
142
-
143
-
144
-
145
-
146
-
147
-
148
-
149
-
150
-
151
-
152
-
153
-
154
-
155
-
156
-
157
-
158
-
159
-
160
-
161
-
162
-
163
-
164
-
165
-
166
-
 167
167 -
 168
168 -
 169
169 -
 170
170 -
 171
171 -
 172
172 -
 173
173 -
 174
174 -
 175
175 -
 176
176 -
 177
177 -
 178
178 -
 179
179 -
 180
180 -
 181
181 -
 182
182 -
 183
183 -
 184
184 -
 185
185 -
 186
186 -
 187
187 -
188
-
189
-
190
-
191
-
192
-
193
-
194
-
195
-
196
-
197
-
198
-
199
-
200
-
201
-
202
-
203
-
204
-
205
-
206
-
207
-
208
-
209
-
210
-
211
-
212
-
213
-
214
-
215
-
216
 |
 |
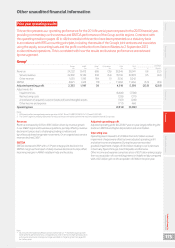
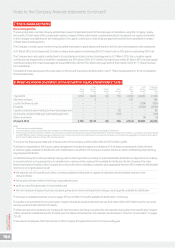
Prior year operating results
This section presents our operating performance for the 2014 nancial year compared to the 2013 nancial year,
providing commentary on the revenue and EBITDA performance of the Group and its regions. Consistent with
the operating results on pages 40 to 48, the results in this section have been presented on a statutory basis
in accordance with IFRS accounting principles, including the results of the Group’s joint ventures and associates
using the equity accounting basis and the prot contribution from Verizon Wireless to 2 September 2013
as discontinued operations. This is consistent with how the results and business performance are reviewed
by management.
Group1
Europe
£m
AMAP
£m
Other2
£m
Eliminations
£m
2014
£m
2013
£m
% change
£Organic
Revenue 24,222 13,473 686 (35) 38,346 38,041 0.8 (2.2)
Service revenue 22,592 12 ,13 0 502 (34) 35,190 34,999 0.5 (2.6)
Other revenue 1,630 1,343 184 (1) 3 ,15 6 3,042
EBITDA 6,821 4 ,145 11 8 –11, 0 8 4 11, 4 6 6 (3.3) (6.9)
Adjusted operating prot 2,333 1,947 30 –4,310 5,590 (22.9) (22.0)
Adjustments for:
Impairment loss (6,600) (7,700)
Restructuring costs (355) (311)
Amortisation of acquired customer bases and brand intangible assets (551) (249)
Other income and expense (717) 468
Operating loss (3,913) (2,202)
Notes:
1 2014 results reect average foreign exchange rates of £1:€1.19 and £1:US$1.59 (2013: £1:€1.23 and £1:US$1.58).
2 The “Other” segment primarily represents the results of the partner markets and the net result of unallocated central Group costs
Revenue
Revenue increased by 0.8% to £38.3 billion driven by revenue growth
in our AMAP region and business acquisitions, partially offset by revenue
declines in Europe due to challenging trading conditions and
by unfavourable exchange rate movements. On an organic basis service
revenue declined 2.6%*.
EBITDA
EBITDA decreased 6.9%* with a 1.5* percentage point decline in the
EBITDA margin as the impact of steep revenue declines in Europe offset
improving margins in AMAP, notably in India and Australia.
Adjusted operating prot
Adjusted operating prot fell 22.0%* year-on-year largely reecting the
decline in EBITDA and higher depreciation and amortisation.
Operating loss
Operating loss increased to £3.9 billion from £2.2 billion as lower
impairment charges were offset by lower adjusted operating prot
and other income and expense. During the year we recorded
goodwill impairment charges of £6.6 billion relating to our businesses
in Germany, Spain, Portugal, Czech Republic and Romania.
Other income and expense comprises a loss of £0.7 billion arising largely
from our acquisition of a controlling interest in Vodafone Italy compared
with a £0.5 billion gain on the acquisition of CWW in the prior year.
Note:
* All amounts in the Operating Results section marked with an “*” represent organic growth
which presents performance on a comparable basis, both in terms of merger and acquisition
activity and movements in foreign exchange rates. Refer to “Organic growth” on page 203
for further detail.
Overview Strategy review Performance Governance Financials Additional information Vodafone Group Plc
Annual Report 2015
175
Other unaudited nancial information