Vodafone 2015 Annual Report Download - page 43
Download and view the complete annual report
Please find page 43 of the 2015 Vodafone annual report below. You can navigate through the pages in the report by either clicking on the pages listed below, or by using the keyword search tool below to find specific information within the annual report.
Overview Strategy review Performance Governance Financials Additional information Vodafone Group Plc
Annual Report 2015
41
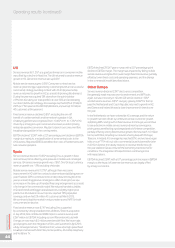
Amortisation of intangible assets in relation to customer bases and
brands are recognised under accounting rules after we acquire
businesses and amounted to £1,269 million (2014: £551 million).
Amortisation charges increased in the year as a result of the acquisitions
of KDG, Vodafone Italy and Ono.
Other income and expense decreased by £0.6 billion due to the
inclusion in the prior year of £0.7 billion loss arising from our acquisition
of a controlling interest in Vodafone Italy.
Including the above items, operating prot increased to £2.0 billion from
a £3.9 billion loss primarily as a result of the £6.6 billion impairment
charge in the year ended 31 March 2014.
Net nancing costs
2015
£m
2014
£m
Investment income 883 346
Financing costs (1,736) (1,554)
Net nancing costs (853) (1,208)
Net nancing costs includes £526 million of foreign exchange gains
(2014: £21 million gain), £134 million of mark-to-market losses
(2014: £118 million gain) and in the prior year, a £99 million loss
on US bond redemption. Excluding these items, net nancing costs
decreased by 7.4% primarily due to the impact of lower average net
debt levels following the disposal of the Group’s investment in Verizon
Wireless and the acquisition of Ono.
Taxation
2015
£m
2014
£m
Income tax
Continuing operations before recognition
of deferred tax 703 2,736
Recognition of additional deferred tax –
continuing operations (5,468) (19,318)
Total income tax credit –
continuing operations (4,765) (16,582)
Tax on adjustments to derive adjusted
prot before tax 305 290
Recognition of deferred tax asset for losses
inGermany and Luxembourg 3,341 19,318
Deferred tax recognised on additional losses
in Luxembourg 2,127 –
Tax liability on US rationalisation
andreorganisation –(2,210)
Deferred tax on use of Luxembourg losses (439) 113
Adjusted income tax expense 569 929
Share of associates’ and joint ventures’ tax 117 173
Adjusted income tax expense for
calculating adjusted tax rate 686 1,102
Prot/(loss) before tax
Continuing operations 1,095 (5,270)
Adjustments to derive adjusted
prot beforetax (see earnings per share on
page 42) 1,122 8,450
Adjusted prot before tax 2,217 3,180
Share of associates’ and joint ventures’ tax
andnon-controlling interest 117 173
Adjusted prot before tax for calculating
adjusted effective tax rate 2,334 3,353
Adjusted effective tax rate 29.4% 32.9%


