Vodafone 2015 Annual Report Download - page 162
Download and view the complete annual report
Please find page 162 of the 2015 Vodafone annual report below. You can navigate through the pages in the report by either clicking on the pages listed below, or by using the keyword search tool below to find specific information within the annual report.-
 1
1 -
2
-
3
-
4
-
5
-
6
-
7
-
8
-
9
-
10
-
11
-
12
-
13
-
14
-
15
-
16
-
17
-
18
-
19
-
20
-
21
-
22
-
23
-
24
-
25
-
26
-
27
-
28
-
29
-
30
-
31
-
32
-
33
-
34
-
35
-
36
-
37
-
38
-
39
-
40
-
41
-
42
-
43
-
44
-
45
-
46
-
47
-
48
-
49
-
50
-
51
-
52
-
53
-
54
-
55
-
56
-
57
-
58
-
59
-
60
-
61
-
62
-
63
-
64
-
65
-
66
-
67
-
68
-
69
-
70
-
71
-
72
-
73
-
74
-
75
-
76
-
77
-
78
-
79
-
80
-
81
-
82
-
83
-
84
-
85
-
86
-
87
-
88
-
89
-
90
-
91
-
92
-
93
-
94
-
95
-
96
-
97
-
98
-
99
-
100
-
101
-
102
-
103
-
104
-
105
-
106
-
107
-
108
-
109
-
110
-
111
-
112
-
113
-
114
-
115
-
116
-
117
-
118
-
119
-
120
-
121
-
122
-
123
-
124
-
125
-
126
-
127
-
128
-
129
-
130
-
131
-
132
-
133
-
134
-
135
-
136
-
137
-
138
-
139
-
140
-
141
-
142
-
143
-
144
-
145
-
146
-
147
-
148
-
149
-
150
-
151
-
 152
152 -
 153
153 -
 154
154 -
 155
155 -
 156
156 -
 157
157 -
 158
158 -
 159
159 -
 160
160 -
 161
161 -
 162
162 -
 163
163 -
 164
164 -
 165
165 -
 166
166 -
 167
167 -
 168
168 -
 169
169 -
 170
170 -
 171
171 -
 172
172 -
173
-
174
-
175
-
176
-
177
-
178
-
179
-
180
-
181
-
182
-
183
-
184
-
185
-
186
-
187
-
188
-
189
-
190
-
191
-
192
-
193
-
194
-
195
-
196
-
197
-
198
-
199
-
200
-
201
-
202
-
203
-
204
-
205
-
206
-
207
-
208
-
209
-
210
-
211
-
212
-
213
-
214
-
215
-
216
 |
 |

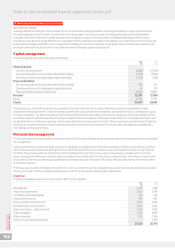
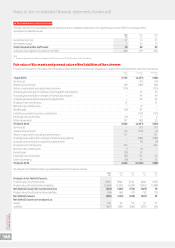
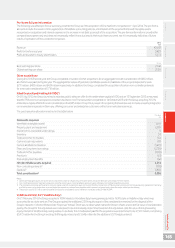
26. Post employment benets (continued)
Charges made to the consolidated income statement and consolidated statement of comprehensive income (‘SOCI’) on the basis of the
assumptions stated above are:
2015 2014 2013
£m £m £m
Current service cost 37 14 27
Net interest charge 320 12
Total included within staff costs 40 34 39
Actuarial losses/(gains) recognised in the SOCI1269 (57) 238
Note:
1 Amounts disclosed in the SOCI are stated net of £57 million of tax (2014: £20 million, 2013: £56 million).
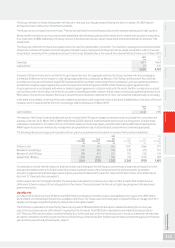
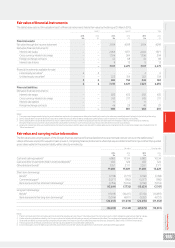
Fair value of the assets and present value of the liabilities of the schemes
The amount included in the statement of nancial position arising from the Group’s obligations in respect of its dened benet schemes is as follows:
Assets Liabilities Net decit
£m £m £m
1 April 2013 3,723 (4,251) (528)
Service cost – (14) (14)
Interest income/(cost) 162 (182) (20)
Return on plan assets excluding interest income (114) – (114)
Actuarial gains arising from changes in demographic assumptions – 35 35
Actuarial gains arising from changes in nancial assumptions – 44 44
Actuarial gains arising from experience adjustments – 92 92
Employer cash contributions 51 – 51
Member cash contributions 7(7) –
Benets paid (81) 81 –
Liabilities assumed in business combinations – (121) (121)
Exchange rate movements (13) 17 4
Other movements 107 (85) 22
31 March 2014 3,842 (4,391) (549)
Service cost – (37) (37)
Interest income/(cost) 176 (179) (3)
Return on plan assets excluding interest income 721 – 721
Actuarial losses arising from changes in nancial assumptions – (982) (982)
Actuarial losses arising from experience adjustments – (8) (8)
Employer cash contributions 404 – 404
Member cash contributions 9(9) –
Benets paid (95) 95 –
Exchange rate movements (83) 116 33
Other movements (18) 41 23
31 March 2015 4,956 (5,354) (398)
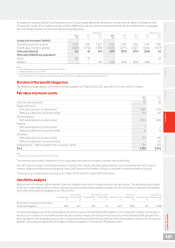
An analysis of net (decit)/assets is provided below for the Group as a whole.
2015 2014 2013 2012 2011
£m £m £m £m £m
Analysis of net (decit)/assets:
Total fair value of scheme assets 4,956 3,842 3,723 1,604 1,558
Present value of funded schemeliabilities (5,288) (4,325) (4,239) (1,853) (1,488)
Net (decit)/assets for funded schemes (332) (483) (516) (249) 70
Present value of unfunded scheme liabilities (66) (66) (12) (12) (13)
Net (decit)/assets (398) (549) (528) (261) 57
Net (decit)/assets are analysed as:
Assets 169 35 52 31 97
Liabilities (567) (584) (580) (292) (40)
Notes to the consolidated nancial statements (continued)
Vodafone Group Plc
Annual Report 2015
160