Vodafone 2015 Annual Report Download - page 180
Download and view the complete annual report
Please find page 180 of the 2015 Vodafone annual report below. You can navigate through the pages in the report by either clicking on the pages listed below, or by using the keyword search tool below to find specific information within the annual report.-
 1
1 -
2
-
3
-
4
-
5
-
6
-
7
-
8
-
9
-
10
-
11
-
12
-
13
-
14
-
15
-
16
-
17
-
18
-
19
-
20
-
21
-
22
-
23
-
24
-
25
-
26
-
27
-
28
-
29
-
30
-
31
-
32
-
33
-
34
-
35
-
36
-
37
-
38
-
39
-
40
-
41
-
42
-
43
-
44
-
45
-
46
-
47
-
48
-
49
-
50
-
51
-
52
-
53
-
54
-
55
-
56
-
57
-
58
-
59
-
60
-
61
-
62
-
63
-
64
-
65
-
66
-
67
-
68
-
69
-
70
-
71
-
72
-
73
-
74
-
75
-
76
-
77
-
78
-
79
-
80
-
81
-
82
-
83
-
84
-
85
-
86
-
87
-
88
-
89
-
90
-
91
-
92
-
93
-
94
-
95
-
96
-
97
-
98
-
99
-
100
-
101
-
102
-
103
-
104
-
105
-
106
-
107
-
108
-
109
-
110
-
111
-
112
-
113
-
114
-
115
-
116
-
117
-
118
-
119
-
120
-
121
-
122
-
123
-
124
-
125
-
126
-
127
-
128
-
129
-
130
-
131
-
132
-
133
-
134
-
135
-
136
-
137
-
138
-
139
-
140
-
141
-
142
-
143
-
144
-
145
-
146
-
147
-
148
-
149
-
150
-
151
-
152
-
153
-
154
-
155
-
156
-
157
-
158
-
159
-
160
-
161
-
162
-
163
-
164
-
165
-
166
-
167
-
168
-
169
-
 170
170 -
 171
171 -
 172
172 -
 173
173 -
 174
174 -
 175
175 -
 176
176 -
 177
177 -
 178
178 -
 179
179 -
 180
180 -
 181
181 -
 182
182 -
 183
183 -
 184
184 -
 185
185 -
 186
186 -
 187
187 -
 188
188 -
 189
189 -
 190
190 -
191
-
192
-
193
-
194
-
195
-
196
-
197
-
198
-
199
-
200
-
201
-
202
-
203
-
204
-
205
-
206
-
207
-
208
-
209
-
210
-
211
-
212
-
213
-
214
-
215
-
216
 |
 |

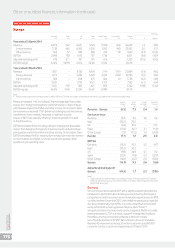
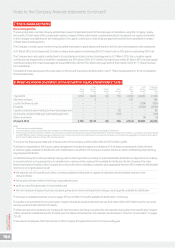
Prior year operating results (continued)
Africa, Middle East and Asia Pacic
India
£m
Vodacom
£m
Other AMAP
£m
Eliminations
£m
AMAP
£m
% change
£Organic
Year ended 31 March 2014
Revenue 3,945 4,718 4,810 –13,473 (1.8) 9.7
Service revenue 3,927 3,866 4,337 –12 ,13 0 (3.5) 7. 4
Other revenue 18 852 473 – 1,343 16.8 34.9
EBITDA 1,13 5 1,716 1,294 –4 ,14 5 (1.2) 11 . 2
Adjusted operating prot 326 1,228 393 –1,947 12.9 31.8
EBITDA margin 28.8% 36.4% 26.9% 30.8%
Year ended 31 March 2013
Revenue 3,907 5,206 4,606 (1) 13,718 (0.7) 8.2
Service revenue 3,878 4,415 4, 276 (1) 12 ,56 8 (1.2) 7. 6
Other revenue 29 791 330 –1,15 0 5.6 14. 8
EBITDA 1,055 1,891 1,250 –4 ,19 6 4.3 13. 8
Adjusted operating prot 15 8 1,332 235 –1,725 7.1 20 .1
EBITDA margin 27.0% 36.3% 27.1% 30.6%
Revenue declined 1.8% mainly as a result of a 12.3 percentage point
adverse impact from foreign exchange rate movements, particularly
with regard to the Indian rupee, the South African rand and the
Turkish lira. On an organic basis service revenue grew 7.4%*, driven
by a higher customer base, increased customer usage and successful
pricing strategies, partially offset by the impact of MTR reductions and
a general weakening in macroeconomic conditions in certain countries.
Growth was led by strong performances in India, Turkey, Qatar and
Ghana and robust performances in Vodacom and Egypt, partly offset
by service revenue declines in New Zealand.
EBITDA decreased 1.2%, including a 13.5 percentage point adverse
impact from foreign exchange rate movements. On an organic basis,
EBITDA grew 11.2%*, driven primarily by strong growth in India,
Turkey, Qatar and Ghana as well as improved contributions from Egypt
and Vodacom.
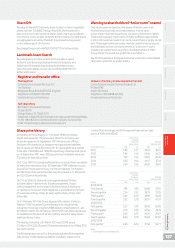
Organic
change*
%
Other
activity
pps
Foreign
exchange
pps
Reported
change
%
Revenue – AMAP 9.7 0.8 (12.3) (1.8)
Service revenue
India 13.0 –(11.7) 1.3
Vodacom 4.1 (2.8) (13.7) (12.4)
Other AMAP 5.7 5.2 (9.5) 1.4
AMAP 7.4 0.9 (11.8) (3.5)
EBITDA
India 20.8 –(13.2) 7. 6
Vodacom 6.6 0.2 (16.1) (9.3)
Other AMAP 9.8 3.2 (9.5) 3.5
AMAP 11.2 1.1 (13.5) (1.2)
Adjusted operating prot
AMAP 31.8 (0.1) (18.8) 12.9
Vodafone Group Plc
Annual Report 2015
178
Other unaudited nancial information (continued)