Vodafone 2015 Annual Report Download - page 47
Download and view the complete annual report
Please find page 47 of the 2015 Vodafone annual report below. You can navigate through the pages in the report by either clicking on the pages listed below, or by using the keyword search tool below to find specific information within the annual report.-
 1
1 -
2
-
3
-
4
-
5
-
6
-
7
-
8
-
9
-
10
-
11
-
12
-
13
-
14
-
15
-
16
-
17
-
18
-
19
-
20
-
21
-
22
-
23
-
24
-
25
-
26
-
27
-
28
-
29
-
30
-
31
-
32
-
33
-
34
-
35
-
36
-
 37
37 -
 38
38 -
 39
39 -
 40
40 -
 41
41 -
 42
42 -
 43
43 -
 44
44 -
 45
45 -
 46
46 -
 47
47 -
 48
48 -
 49
49 -
 50
50 -
 51
51 -
 52
52 -
 53
53 -
 54
54 -
 55
55 -
 56
56 -
 57
57 -
58
-
59
-
60
-
61
-
62
-
63
-
64
-
65
-
66
-
67
-
68
-
69
-
70
-
71
-
72
-
73
-
74
-
75
-
76
-
77
-
78
-
79
-
80
-
81
-
82
-
83
-
84
-
85
-
86
-
87
-
88
-
89
-
90
-
91
-
92
-
93
-
94
-
95
-
96
-
97
-
98
-
99
-
100
-
101
-
102
-
103
-
104
-
105
-
106
-
107
-
108
-
109
-
110
-
111
-
112
-
113
-
114
-
115
-
116
-
117
-
118
-
119
-
120
-
121
-
122
-
123
-
124
-
125
-
126
-
127
-
128
-
129
-
130
-
131
-
132
-
133
-
134
-
135
-
136
-
137
-
138
-
139
-
140
-
141
-
142
-
143
-
144
-
145
-
146
-
147
-
148
-
149
-
150
-
151
-
152
-
153
-
154
-
155
-
156
-
157
-
158
-
159
-
160
-
161
-
162
-
163
-
164
-
165
-
166
-
167
-
168
-
169
-
170
-
171
-
172
-
173
-
174
-
175
-
176
-
177
-
178
-
179
-
180
-
181
-
182
-
183
-
184
-
185
-
186
-
187
-
188
-
189
-
190
-
191
-
192
-
193
-
194
-
195
-
196
-
197
-
198
-
199
-
200
-
201
-
202
-
203
-
204
-
205
-
206
-
207
-
208
-
209
-
210
-
211
-
212
-
213
-
214
-
215
-
216
 |
 |

Overview Strategy review Performance Governance Financials Additional information Vodafone Group Plc
Annual Report 2015
45
Africa, Middle East and Asia Pacic
India
£m
Vodacom
£m
Other AMAP
£m
Eliminations
£m
AMAP
£m
2014
£m
% change
£Organic
Year ended 31 March 2015
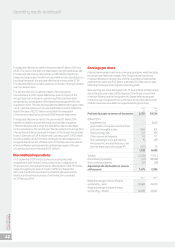
Revenue 4,324 4,341 4,828 (11) 13,482 13,473 0.1 7.0
Service revenue 4,306 3,489 4 , 251 (11) 12,035 12,130 (0.8) 5.8
Other revenue 18 852 577 –1,447 1,343
EBITDA 1,281 1,527 1,289 –4,097 4,145 (1.2) 5.8
Adjusted operating prot 457 1,030 326 –1,813 1,947 (6.9) –
EBITDA margin 29.6% 35.2% 26.7% 30.4% 30.8%
Revenue grew 0.1% as a result of a 7.4 percentage point adverse impact
from foreign exchange movements, particularly with regards to the
Indian rupee, South African rand and the Turkish lira. On an organic
basis service revenue was up 5.8%* driven by a growth in the customer
base, increased voice usage, strong demand for data and continued
good commercial execution. Overall growth was offset by MTR cuts,
particularly in South Africa. Excluding MTRs, organic growth was 7.1%.
EBITDA declined 1.2%, including a 7.1 percentage point adverse impact
from foreign exchange movements. On an organic basis, EBITDA
grew 5.8%* driven by growth in India, Turkey, Qatar and Egypt, offset
by Vodacom and New Zealand.
Organic
change
%
Other
activity1
pps
Foreign
exchange
pps
Reported
change
%
Revenue – AMAP 7.0 0.5 (7.4) 0.1
Service revenue
India 12.6 –(2.9) 9.7
Vodacom (1.0) –(8.8) (9.8)
Other AMAP 5.5 1.7 (9.2) (2.0)
AMAP 5.8 0.6 (7.2) (0.8)
EBITDA
India 16.3 –(3.4) 12.9
Vodacom (2.1) –(8.9) (11.0)
Other AMAP 6.6 0.3 (7. 3) (0.4)
AMAP 5.8 0.1 (7.1) (1.2)
AMAP adjusted
operating prot – – (6.9) (6.9)
Note:
1 “Other activity” includes the impact of M&A activity. Refer to “Organic growth” on page 203
for further detail.
India
Service revenue increased 12.6%*, driven by continued customer base
growth, an acceleration in 3G data uptake and stable voice pricing.
Q4 service revenue grew 12.1%*.
We added 17.2 million mobile customers during the year, taking the
total to 183.8 million. Voice yields were relatively at after a period
of improvement, but we saw a decline in average minutes of use in H2
as competition increased in some circles.
Customer demand for data services has been very strong. Total data
usage grew 86% year-on-year, with the active data customer base
increasing 23% to 64 million. Within this, the 3G customer base
increased to over 19 million, reecting the signicant investment in our
3G network build. During the year we added 12,585 new 3G sites, taking
the total to over 35,000 and our coverage of target urban areas to 90%.
3G internet revenue rose 140%.
In March 2015 we successfully bid for spectrum in 12 telecom circles
for a total cost of INR 258.1 billion (£2.78 billion). This included spectrum
in all six of our 900MHz circles due for extension in December 2015.
We also successfully bid for new 3G spectrum in seven circles, allowing
us to address 88% of our revenue base with 3G services.
We have continued to expand our M-Pesa mobile money transfer
service, and now have 89,000 agents, with a nationwide presence.
At March 2015 we had 3.1 million registered customers and 378,000
active users. Our strategy is to focus on building scale on specic
migratory corridors.
EBITDA grew 16.3%*, with a 0.9* percentage point improvement
in EBITDA margin as economies of scale from growing service revenue
were partly offset by the increase in operating costs related to the
Project Spring network build and higher acquisition costs.
Vodacom
Vodacom Group service revenue declined 1.0%*, as the negative
impact of MTR cuts and a more competitive environment in South
Africa offset growth in Vodacom’s operations outside South Africa.
Q4 service revenue was -0.2%*, reecting some easing of competition
in South Africa.
In South Africa, organic service revenue declined -2.7%*. Excluding the
impact of MTR cuts, service revenue grew 1.4%*. Strong growth
in smartphone penetration and data adoption drove 23.4% growth
in local currency data revenue, although this was offset by aggressive
voice price competition. We have increased our 3G footprint to 96%
population coverage and 4G to 35% coverage as part of the Project
Spring programme, with 81% of sites now connected to high capacity
backhaul. During the year we began to trial our rst bre to the business
services, and bre to the home. The regulatory authorities continue
to review our proposed acquisition of Neotel, a bre-based xed
line operator.
Service revenue growth in Vodacom’s operations outside South
Africa was 4.8%*, driven by customer base growth, data take-up and
M-Pesa, Active M-Pesa customers totalled 5.6 million, with M-Pesa now
representing 23% of service revenue in Tanzania.
Vodacom Group EBITDA fell 2.1%*, with a 1.1* percentage point decline
in EBITDA margin. The signicant negative impact of MTR cuts on the
EBITDA margin was substantially offset by good cost control.